
Threat Hunting with ElasticStack
this project was carried out by Rabab HABYB ELLAH, Yasser HADDAM, Anas HAQOUN, Nouha LAAOUIMIR and me Reda BELHAJ and it was supervised by Prof. Anass SEBBAR.
And I want to thank Andrew Pease for his help, advice and support. And for further information please see Threat Hunting with Elastic Stack.
Setting up Network
The first thing that we need to do is to create our network using virtualization and for this project we use the hypervisor VirtualBox:
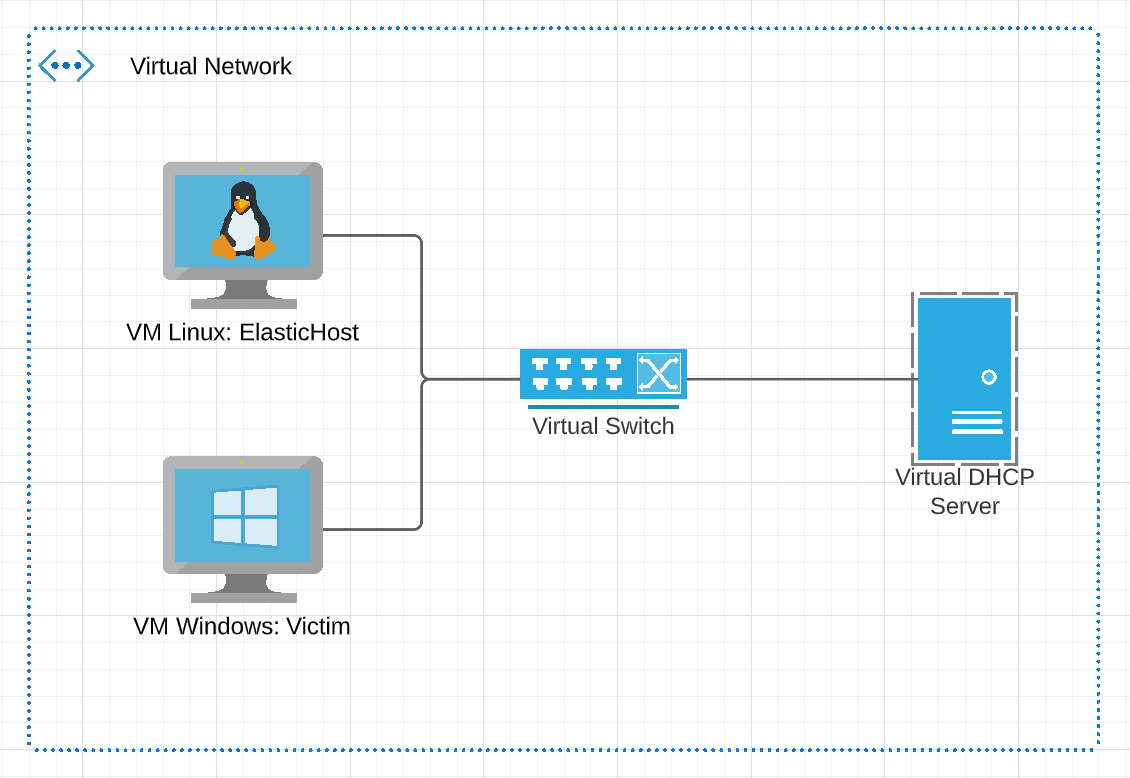
- VM Linux represent our ElasticHost and we choose Ubuntu operating system to manipulate the stack.
- VM Windows represent the victim and the agent that we will capture traffic and logs and also elaborate some infection scenarios.
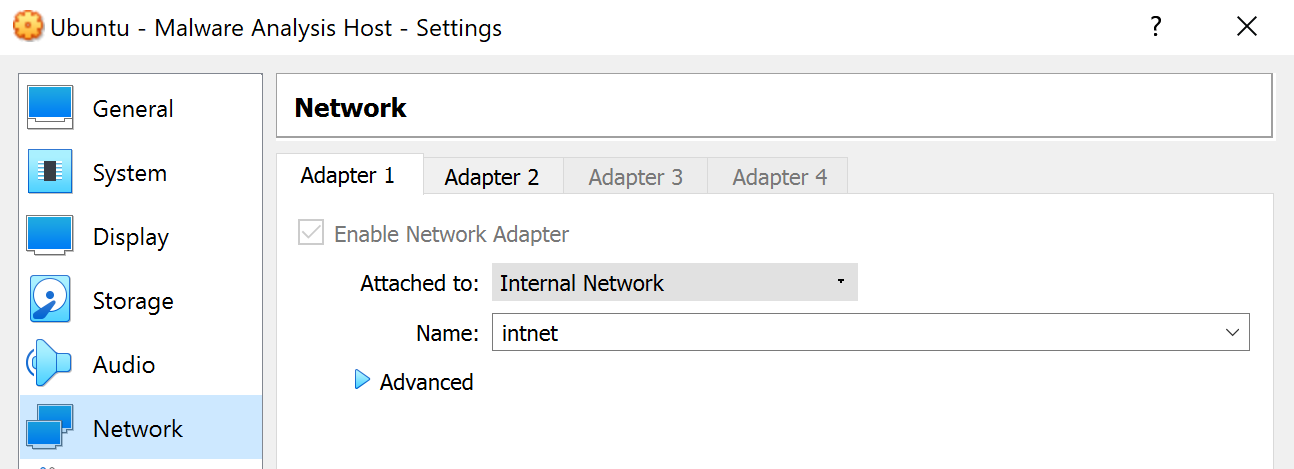
- Virtual DHCP Server is a customize DHCP server for the VirtualBox internal network.
Creation of a DHCP server with the utility of VirtualBox: (VBoxManage):
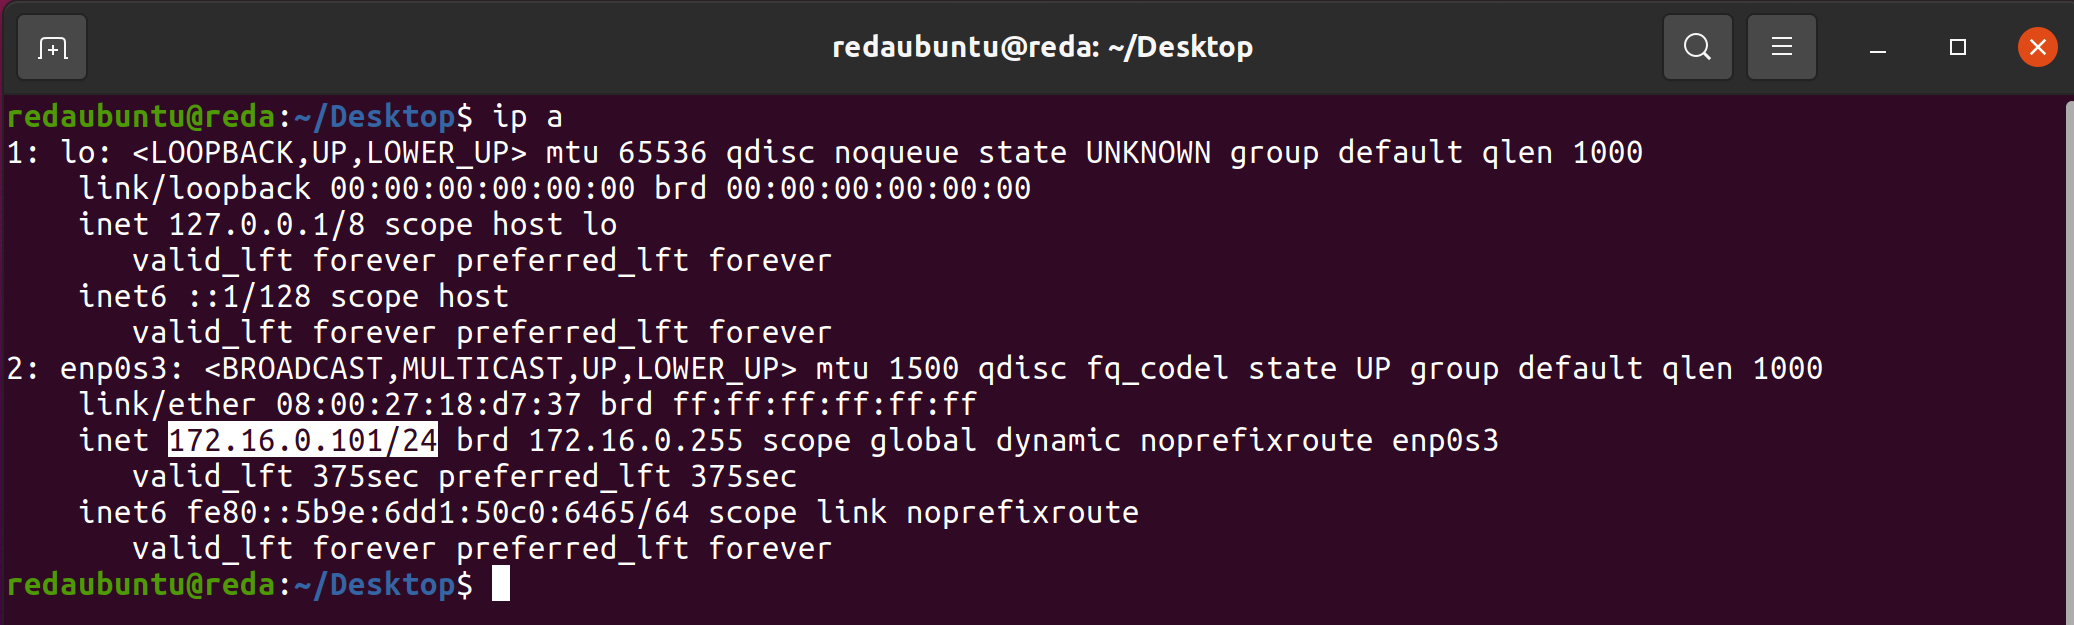
VBoxManage dhcpserver add --network=intnet --server-ip=172.16.0.100 --netmask=255.255.255.0 --lower-ip=172.16.0.101 --upper-ip=172.16.0.254 --enableThe dhcpserver commands enable you to control the DHCP server that is built into VirtualBox.
ElasticHost Port Forwarding configurations
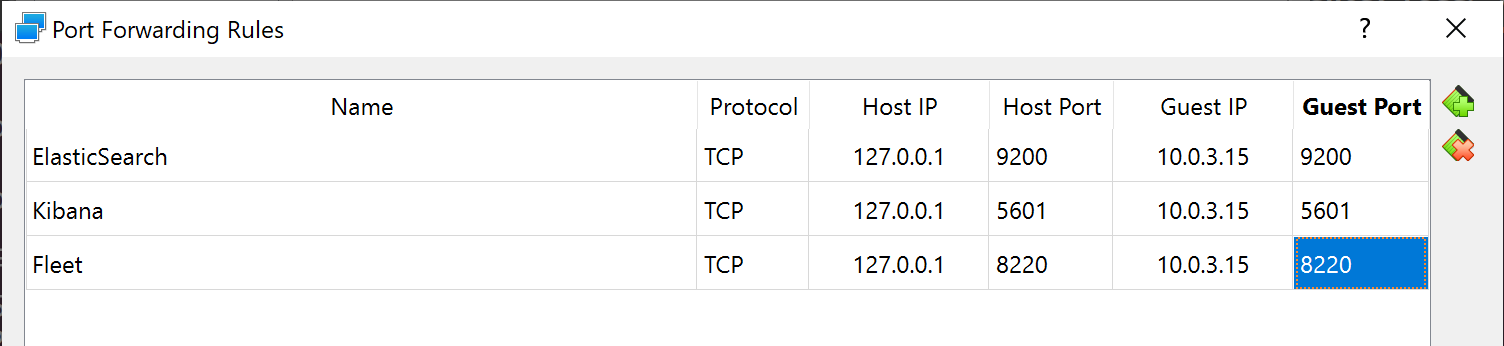
Port forwarding or port mapping is an application of network address translation that redirects a communication request from one address and port number combination to another while the packets are traversing a network gateway.
And we will use the Port Forwarding network feature of VirtualBox, and configure it to access the Kibana dashboards:
Firewall configuration with UFW:
Uncomplicated Firewall(UFW) is a program for managing a network filter firewall designed to be easy to use. And we will allow traffic on port 5601, 9200 and 8220:
sudo ufw allow 5601/tcp
sudo ufw allow 9200/tcp
sudo ufw allow 8220/tcp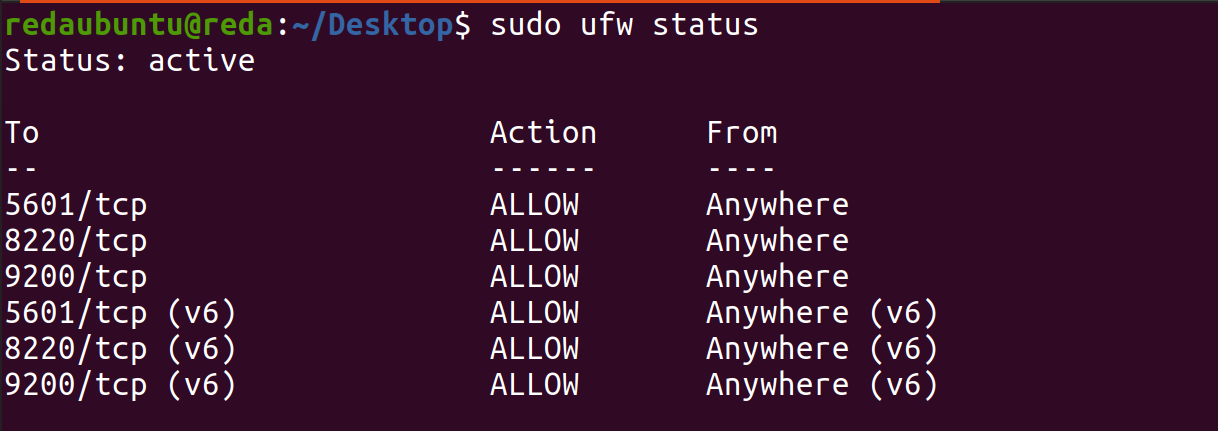
Elastic Stack Installation
Elastic Stack is a group of open source products from Elastic designed to help users take data from any type of source and in any format and search, analyze, and visualize that data in real time.
Elastic Search Installation
Elastic Search is a RESTful distributed search engine built on top of Apache Lucene and released under an Apache license. It is Java based and can search and index document files in diverse formats.
sudo apt-get install elasticsearchConfiguration by opening elasticsearch.yml :
sudo nano /etc/elasticsearch/elasticsearch.ymlUncommenting [network.host](http://network.host) and http.port and adding a secure layer with xpack.
xpack.security.enabled: true
discovery.type: single-node
discovery.seed_hosts: ["0.0.0.0"]
xpack.security.authc.api_key.enabled: true
#
network.host: 0.0.0.0
#
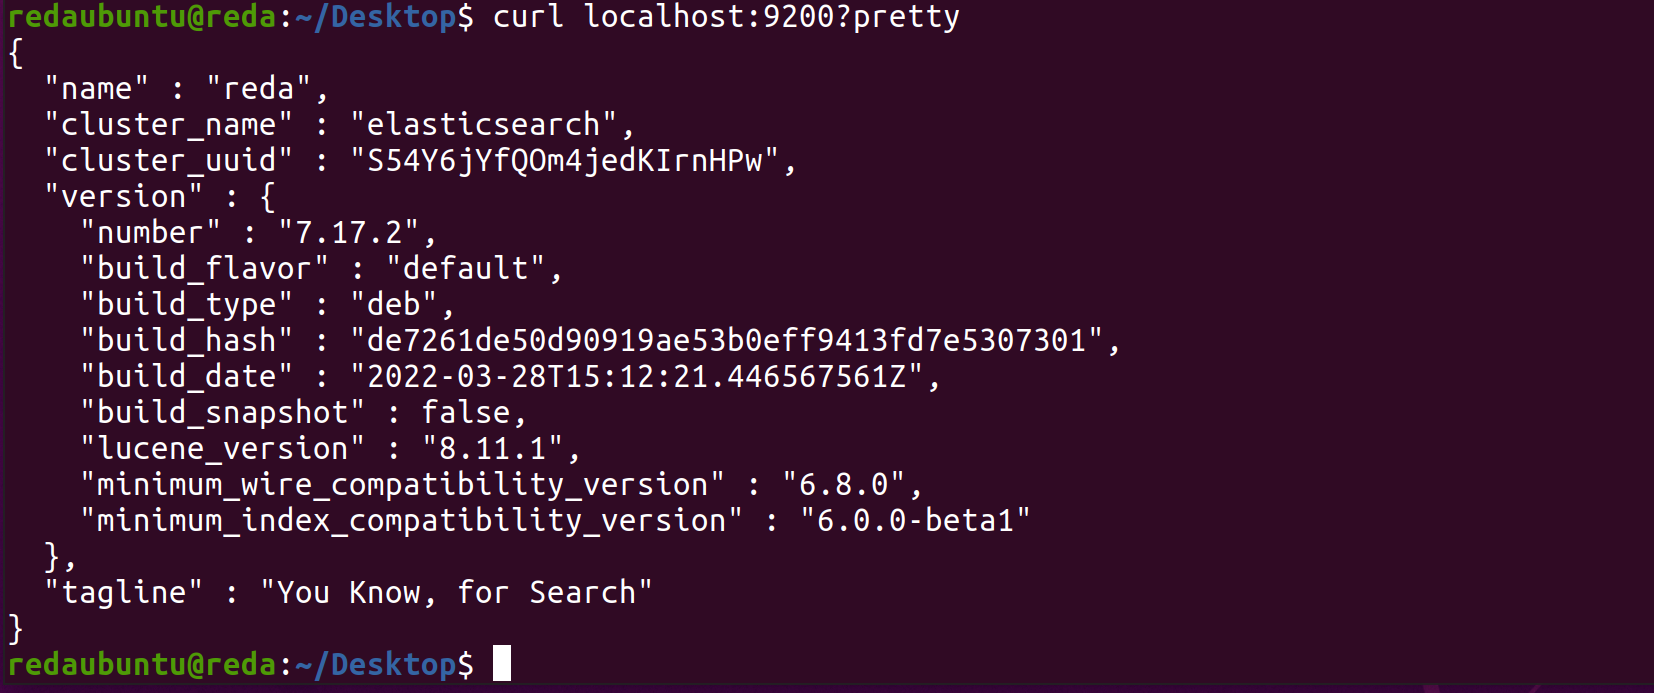
http.port: 9200Launch:
sudo systemctl start elasticsearch.service
sudo systemctl enable elasticsearch.service
To test if elastic is active we test it with cURL:
After we setup the passwords to access elasticsearch in Password Setup:
sudo /usr/share/elasticsearch/bin/elasticsearch-setup-passwords interactive
sudo systemctl restart elasticsearch.service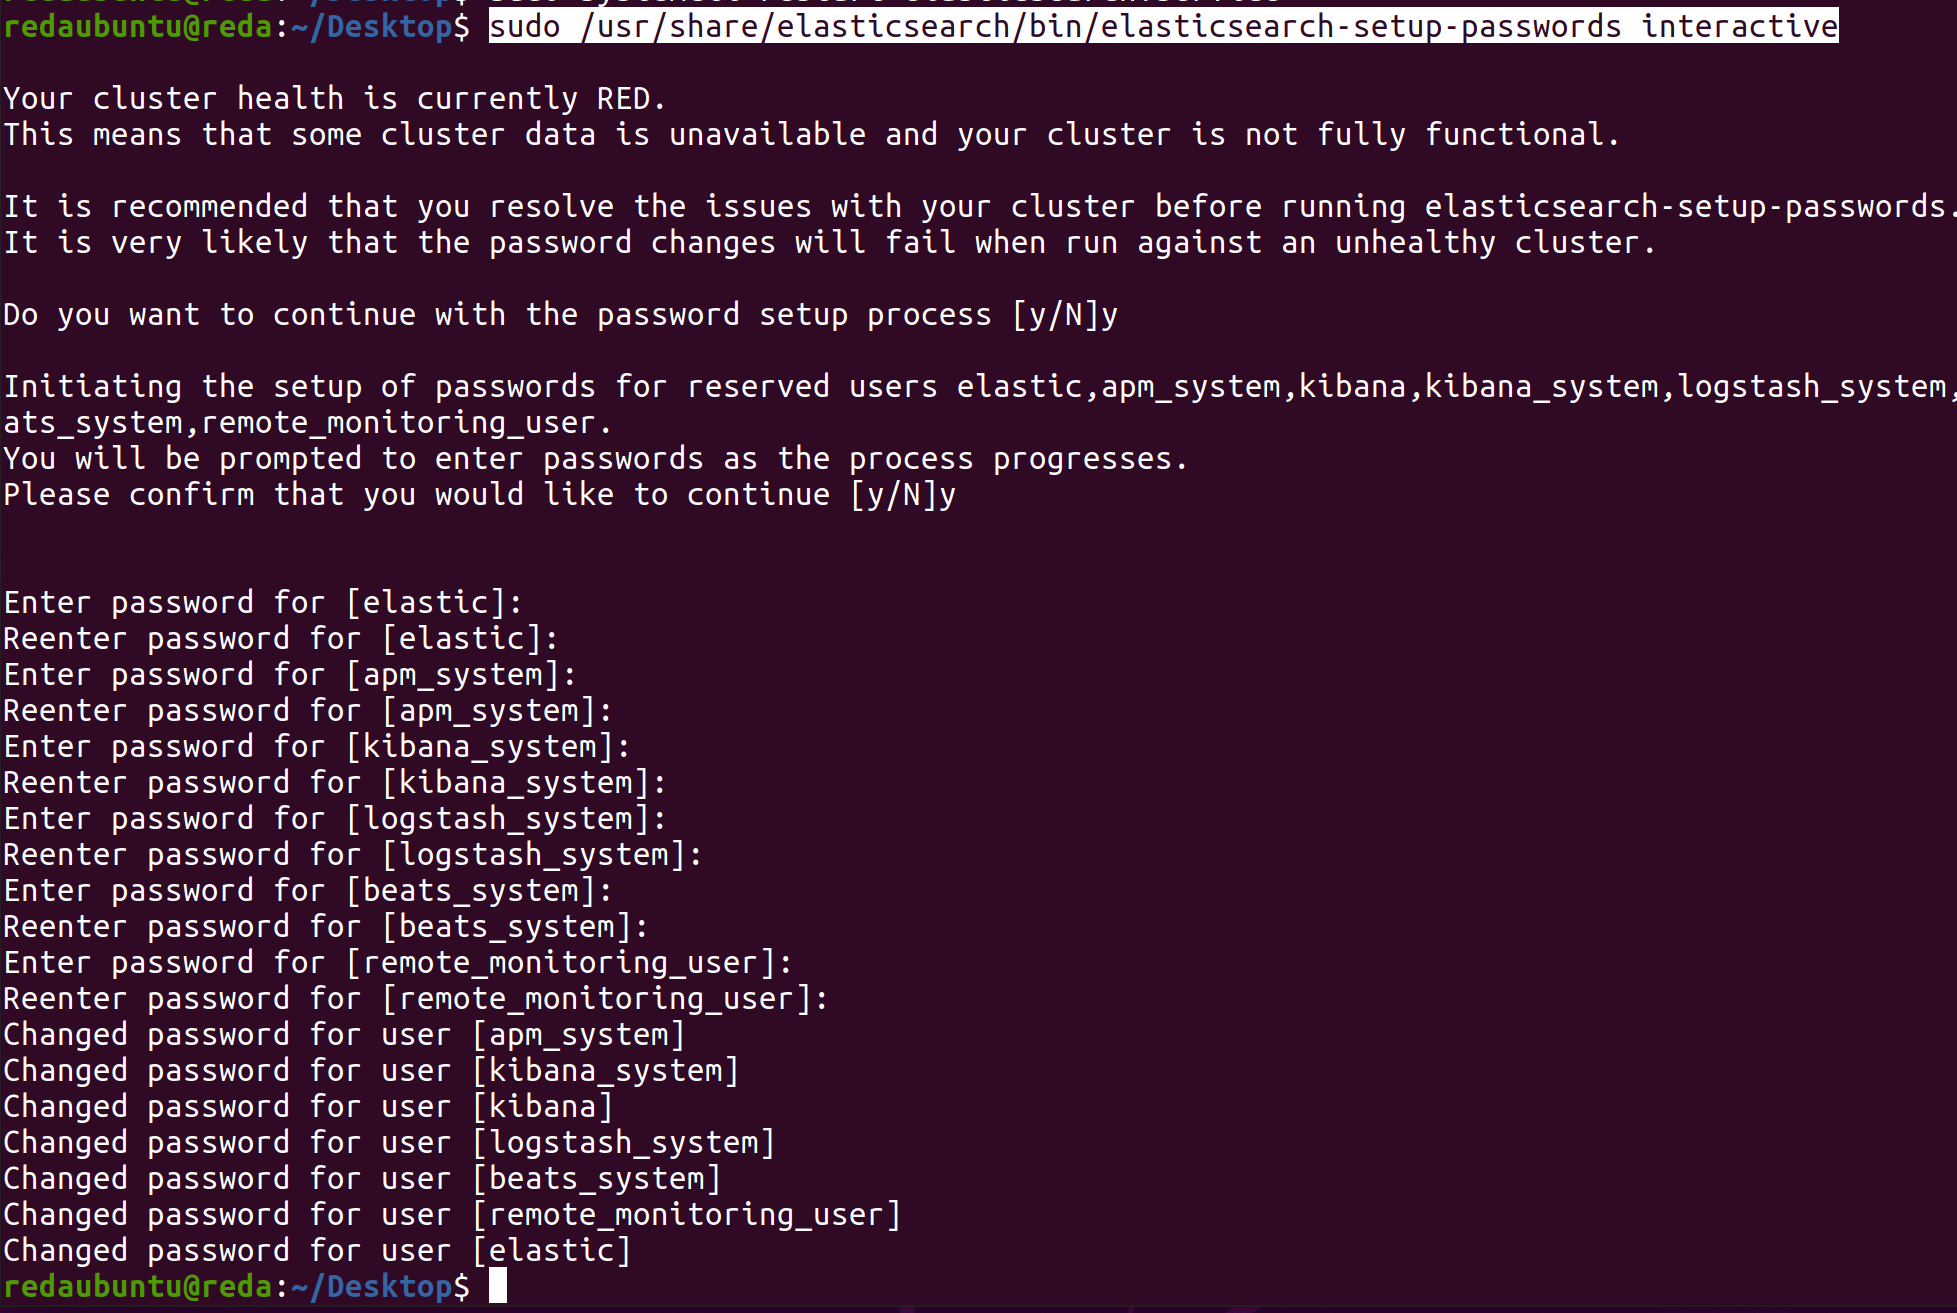
Kibana Installation
Kibana is an open source data visualization and exploration tool from that is specialized for large volumes of streaming and real-time data. The software makes huge and complex data streams more easily and quickly understandable through graphic representation.
sudo apt-get install kibanaConfiguration the kibana.yml file:
sudo nano /etc/kibana/kibana.ymlUncommenting [server.host](http://network.host) and server.port and adding a secure layer with xpack.
xpack.encryptedSavedObjects.encryptionKey: "74072937906854541743857287240528"
# Any random 32 length value will do
xpack.fleet.agents.tlsCheckDisabled: true
#
server.port: 5601
#
server.host: "0.0.0.0"
#
elasticsearch.hosts: ["http://localhost:9200"]
#
elasticsearch.username: "kibana_system"
elasticsearch.password: "password"
Launch:
sudo systemctl start kibana
sudo systemctl enable kibana
If the UFW firewall is enabled on your Ubuntu system, you need to allow traffic on port 5601 to access the Kibana dashboard.
sudo ufw allow 5601/tcpElastic-agent Installation
Elastic Agent is a single, unified agent that you deploy to hosts or containers to collect data and send it to the Elastic Stack. Behind the scenes, Elastic Agent runs the Beats shippers or Elastic Endpoint required for your configuration.
sudo apt-get install elastic-agentLaunch:
sudo systemctl start elastic-agent
sudo systemctl enable elastic-agent
Enabling the detection engine and Fleet
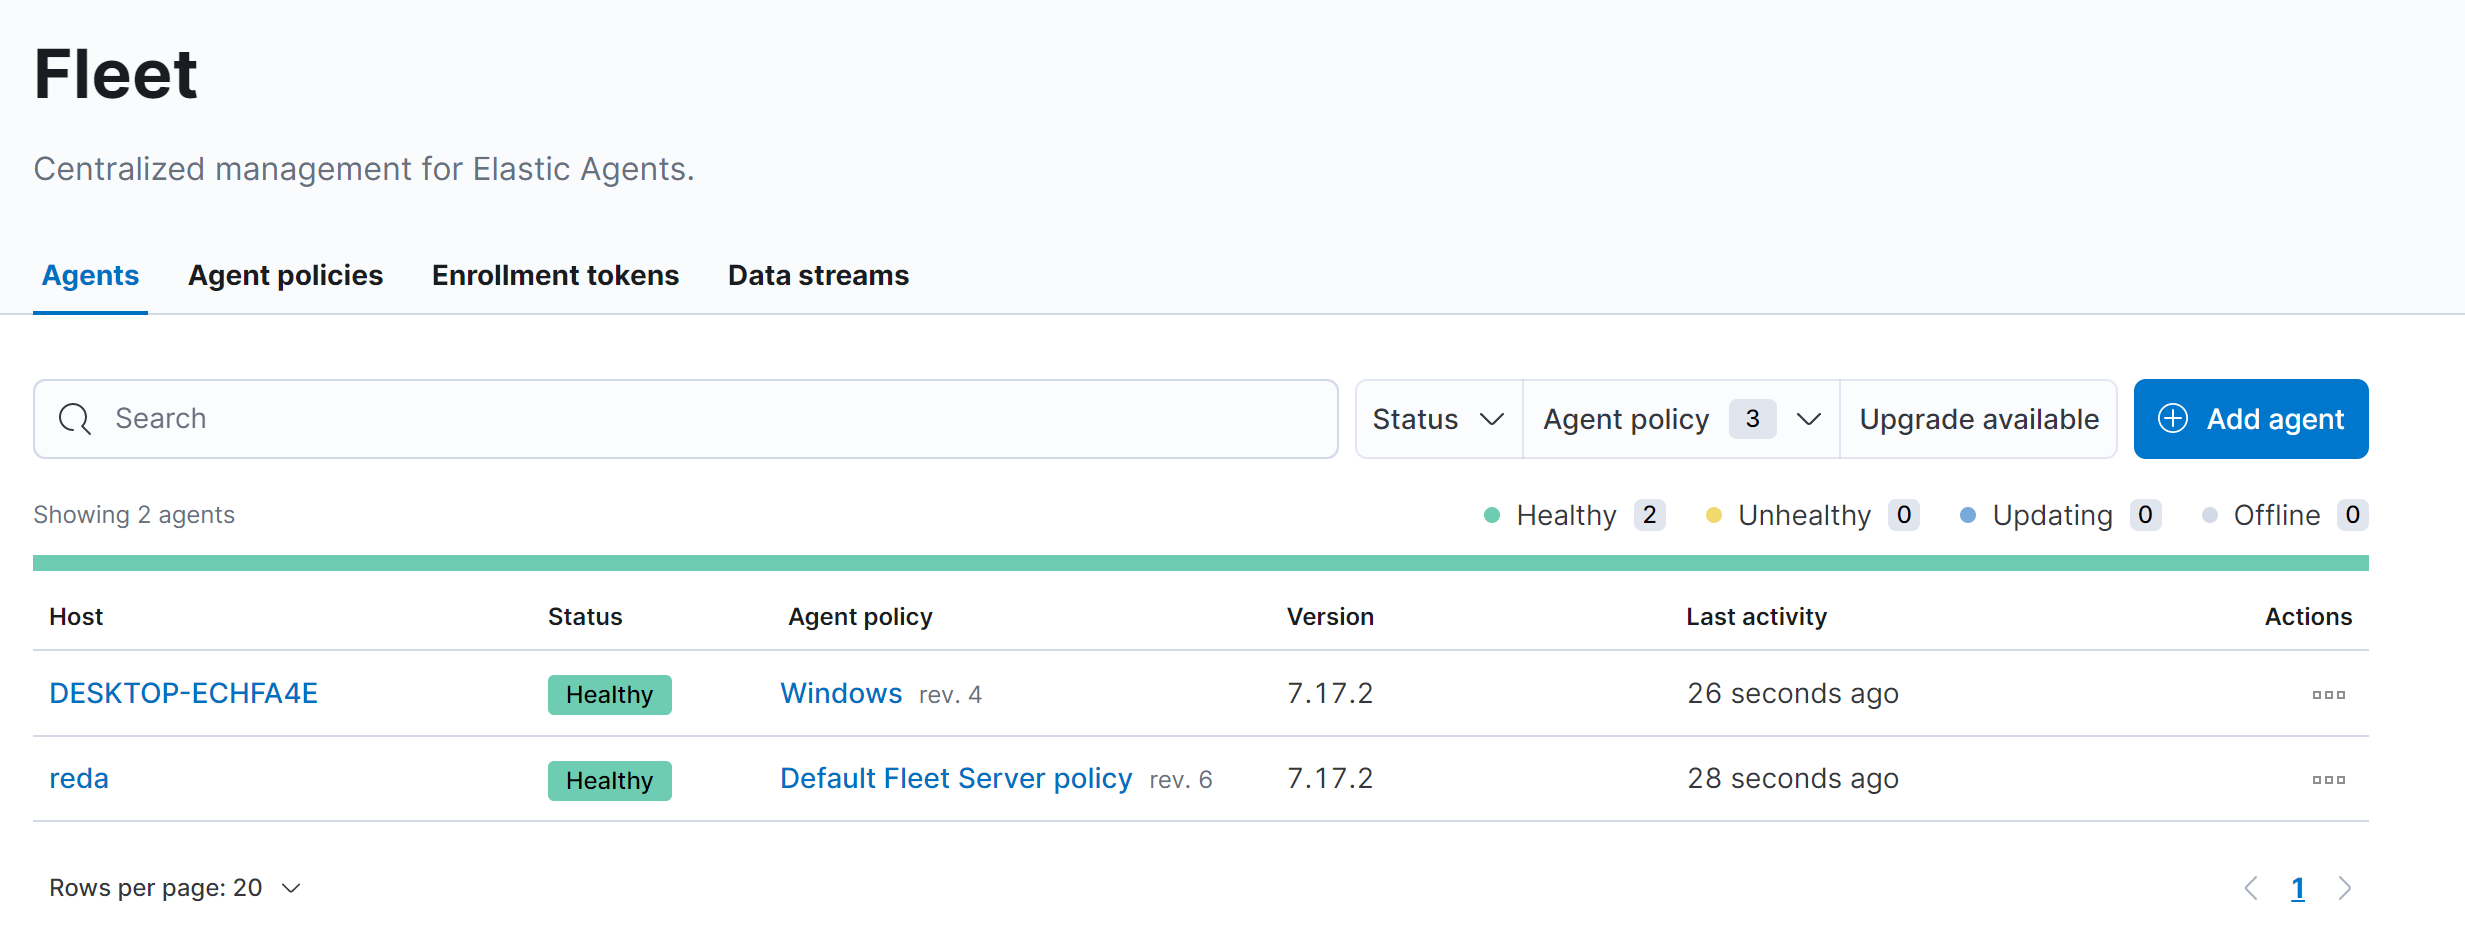
Fleet provides a web-based UI in Kibana for centrally managing Elastic Agents and their policies.
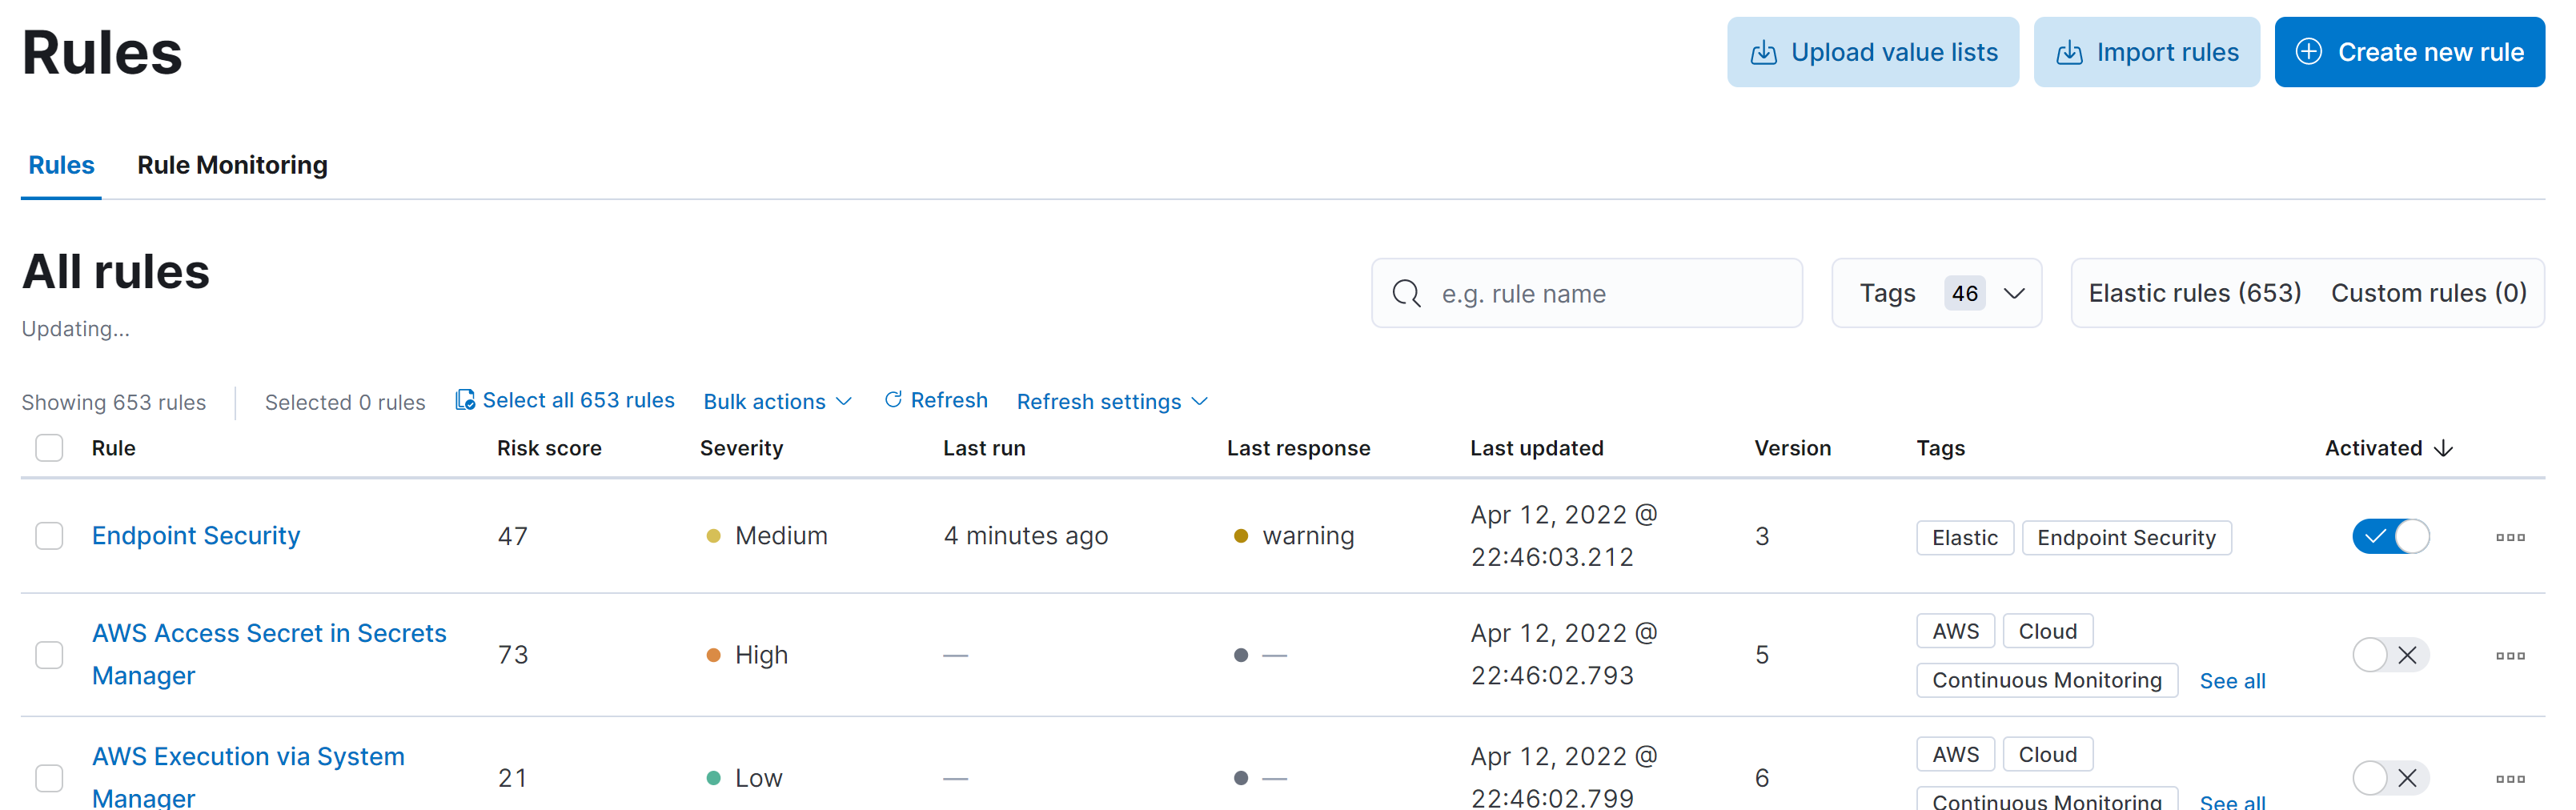
First we go into Security Rules:

Then we load Elastic prebuilt rules and timeline templates:
And now we need to configure Fleet. So we’re going to add an agent in Add Agent Button in the Fleet>Agents:
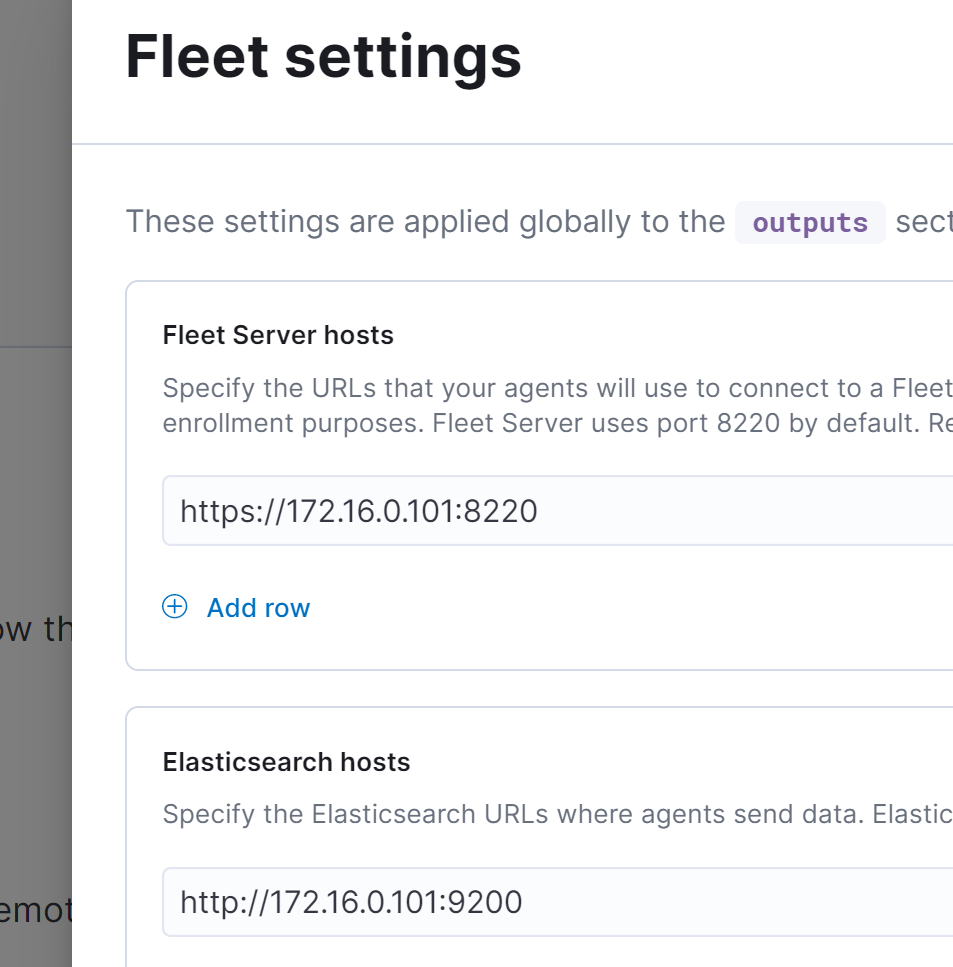
Then go to our ElasticHost (Ubuntu VM) and enroll the fleet configuration
sudo elastic-agent enroll -f --fleet-server-es=http://172.16.0.101:9200 --fleet-server-service-token=AAEAAWVsYXN0aWMvZmxlZXQtc2VydmVyL3Rva2VuLTE2NDk4MDg0OTE5MDA6bmhiMnc3WXFSLXV6bG5CdmhrdEs2dwTo test if the fleet server is running or not and his status we use cURL:
curl -f https://localhost:8220/api/status --insecureFilebeat Installation and Enabling ThreatIntel module
Filebeat is a lightweight shipper for forwarding and centralizing log data. Installed as an agent on your servers, Filebeat monitors the log files or locations that you specify, collects log events, and forwards them either to Elasticsearch or Logstash for indexing.
sudo apt-get install filebeatThreatIntel ingests data from a collection of different threat intelligence sources. The ingested data is meant to be used with Indicator Match rules, but is also compatible with other features like Enrich Processors.
sudo filebeat modules enable threatintelConfiguring ThreatIntel:
sudo gedit /etc/filebeat/modules.d/threatintel.yml/etc/filebeat/modules.d/threatintel.yml
misp:
    enabled: false
#
otx:
    enabled: false
#
var.username: guest
#
var.password: guest
/etc/filebeat/filebeat.yml
sudo gedit /etc/filebeat/filebeat.ymlWe have to uncomment the elasticsearch part and modify it
# ---------------------------- Elasticsearch Output ----------------------------
output.elasticsearch:
  # Array of hosts to connect to.
  hosts: ["localhost:9200"]

  # Protocol - either `http` (default) or `https`.
  #protocol: "https"

  # Authentication credentials - either API key or username/password.
  #api_key: "id:api_key"
  username: "elastic"
  password: "password"
#output.logstash:
    #hosts: ["localhost:5044"]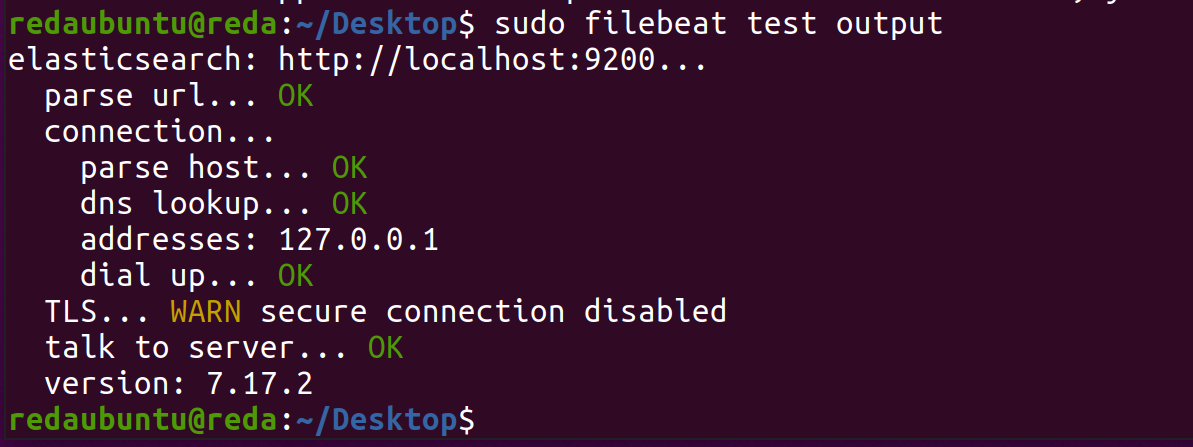
Launch filebeat setup with :
sudo filebeat setupThen start the filebeat service:
sudo systemctl start filebeatAfter some minutes we can see in the Index Management view the filebeat index.
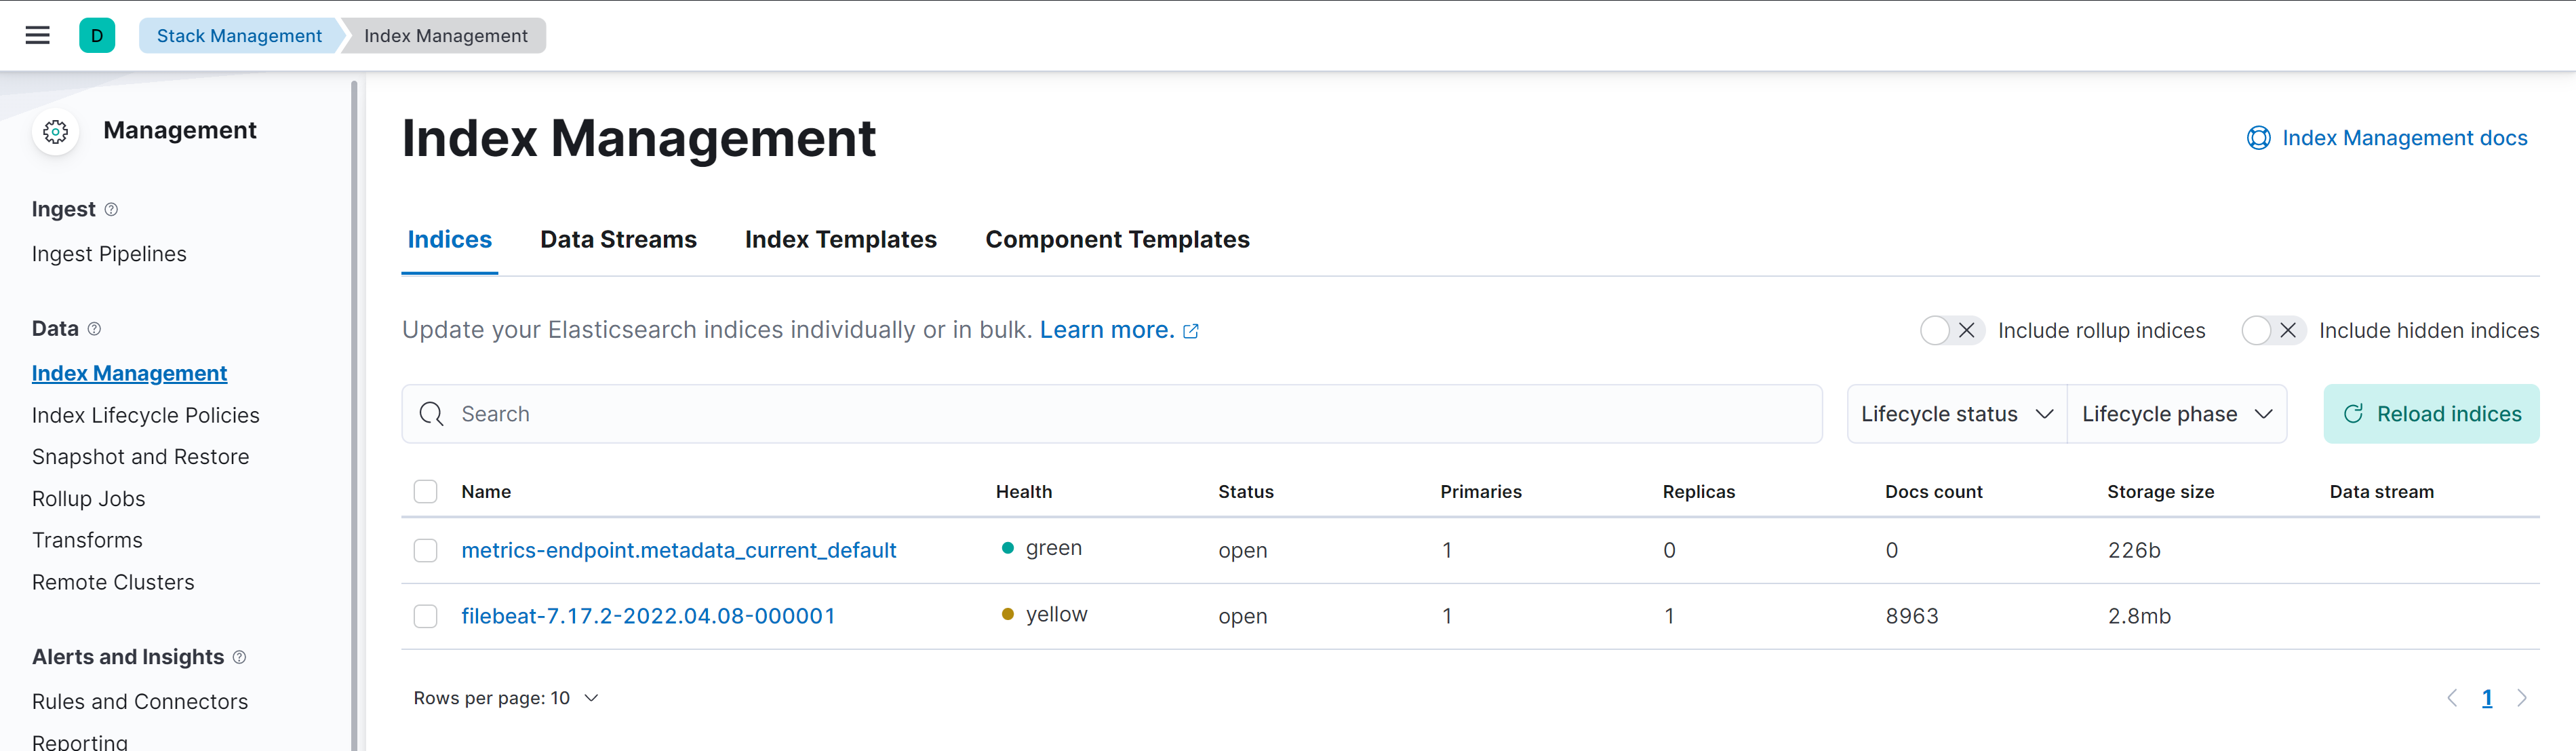
Pipelines are also been created
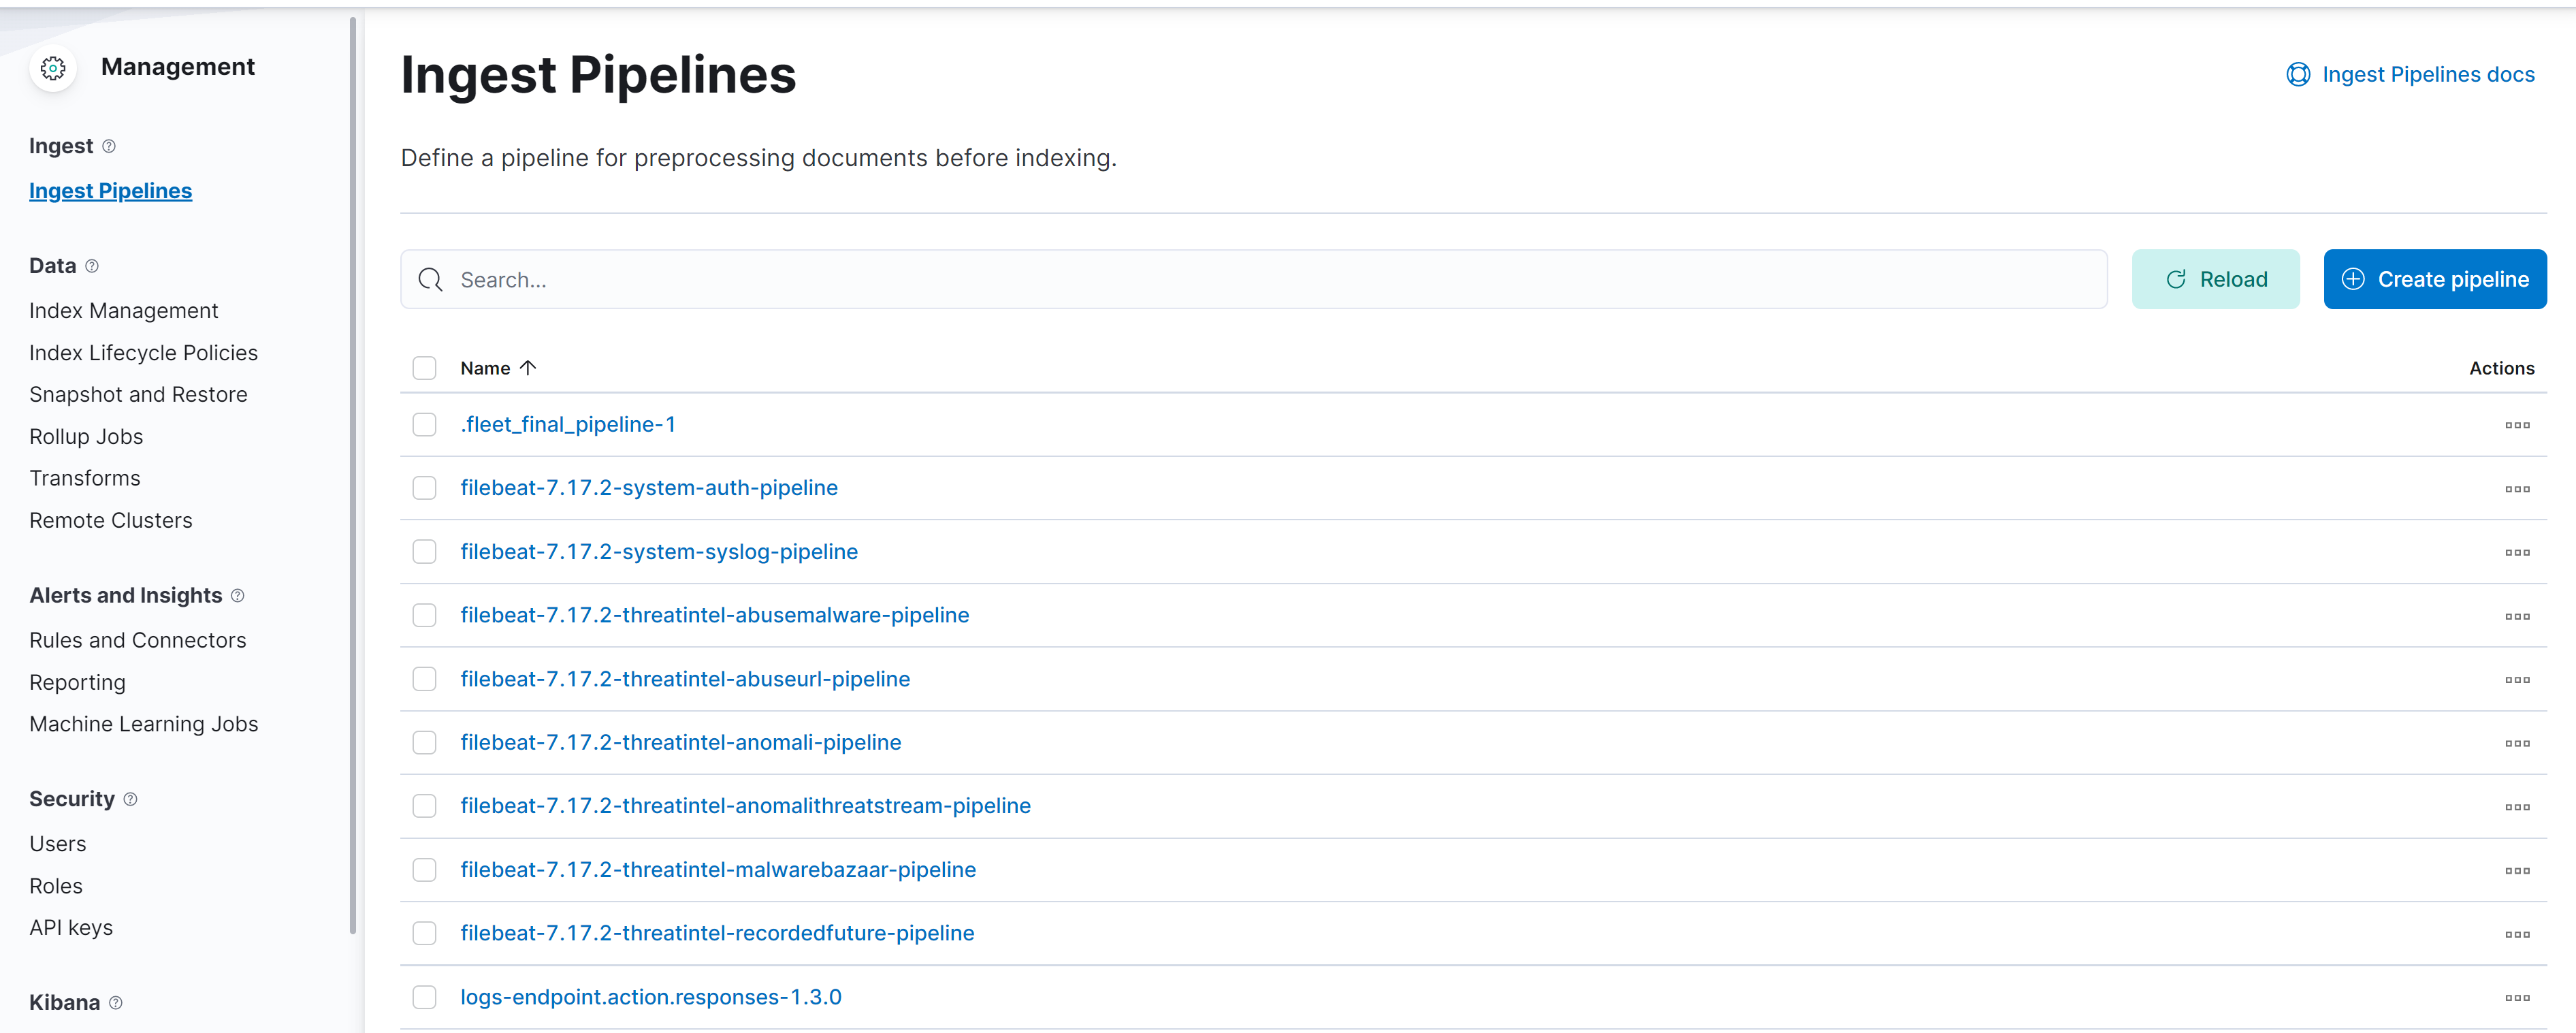
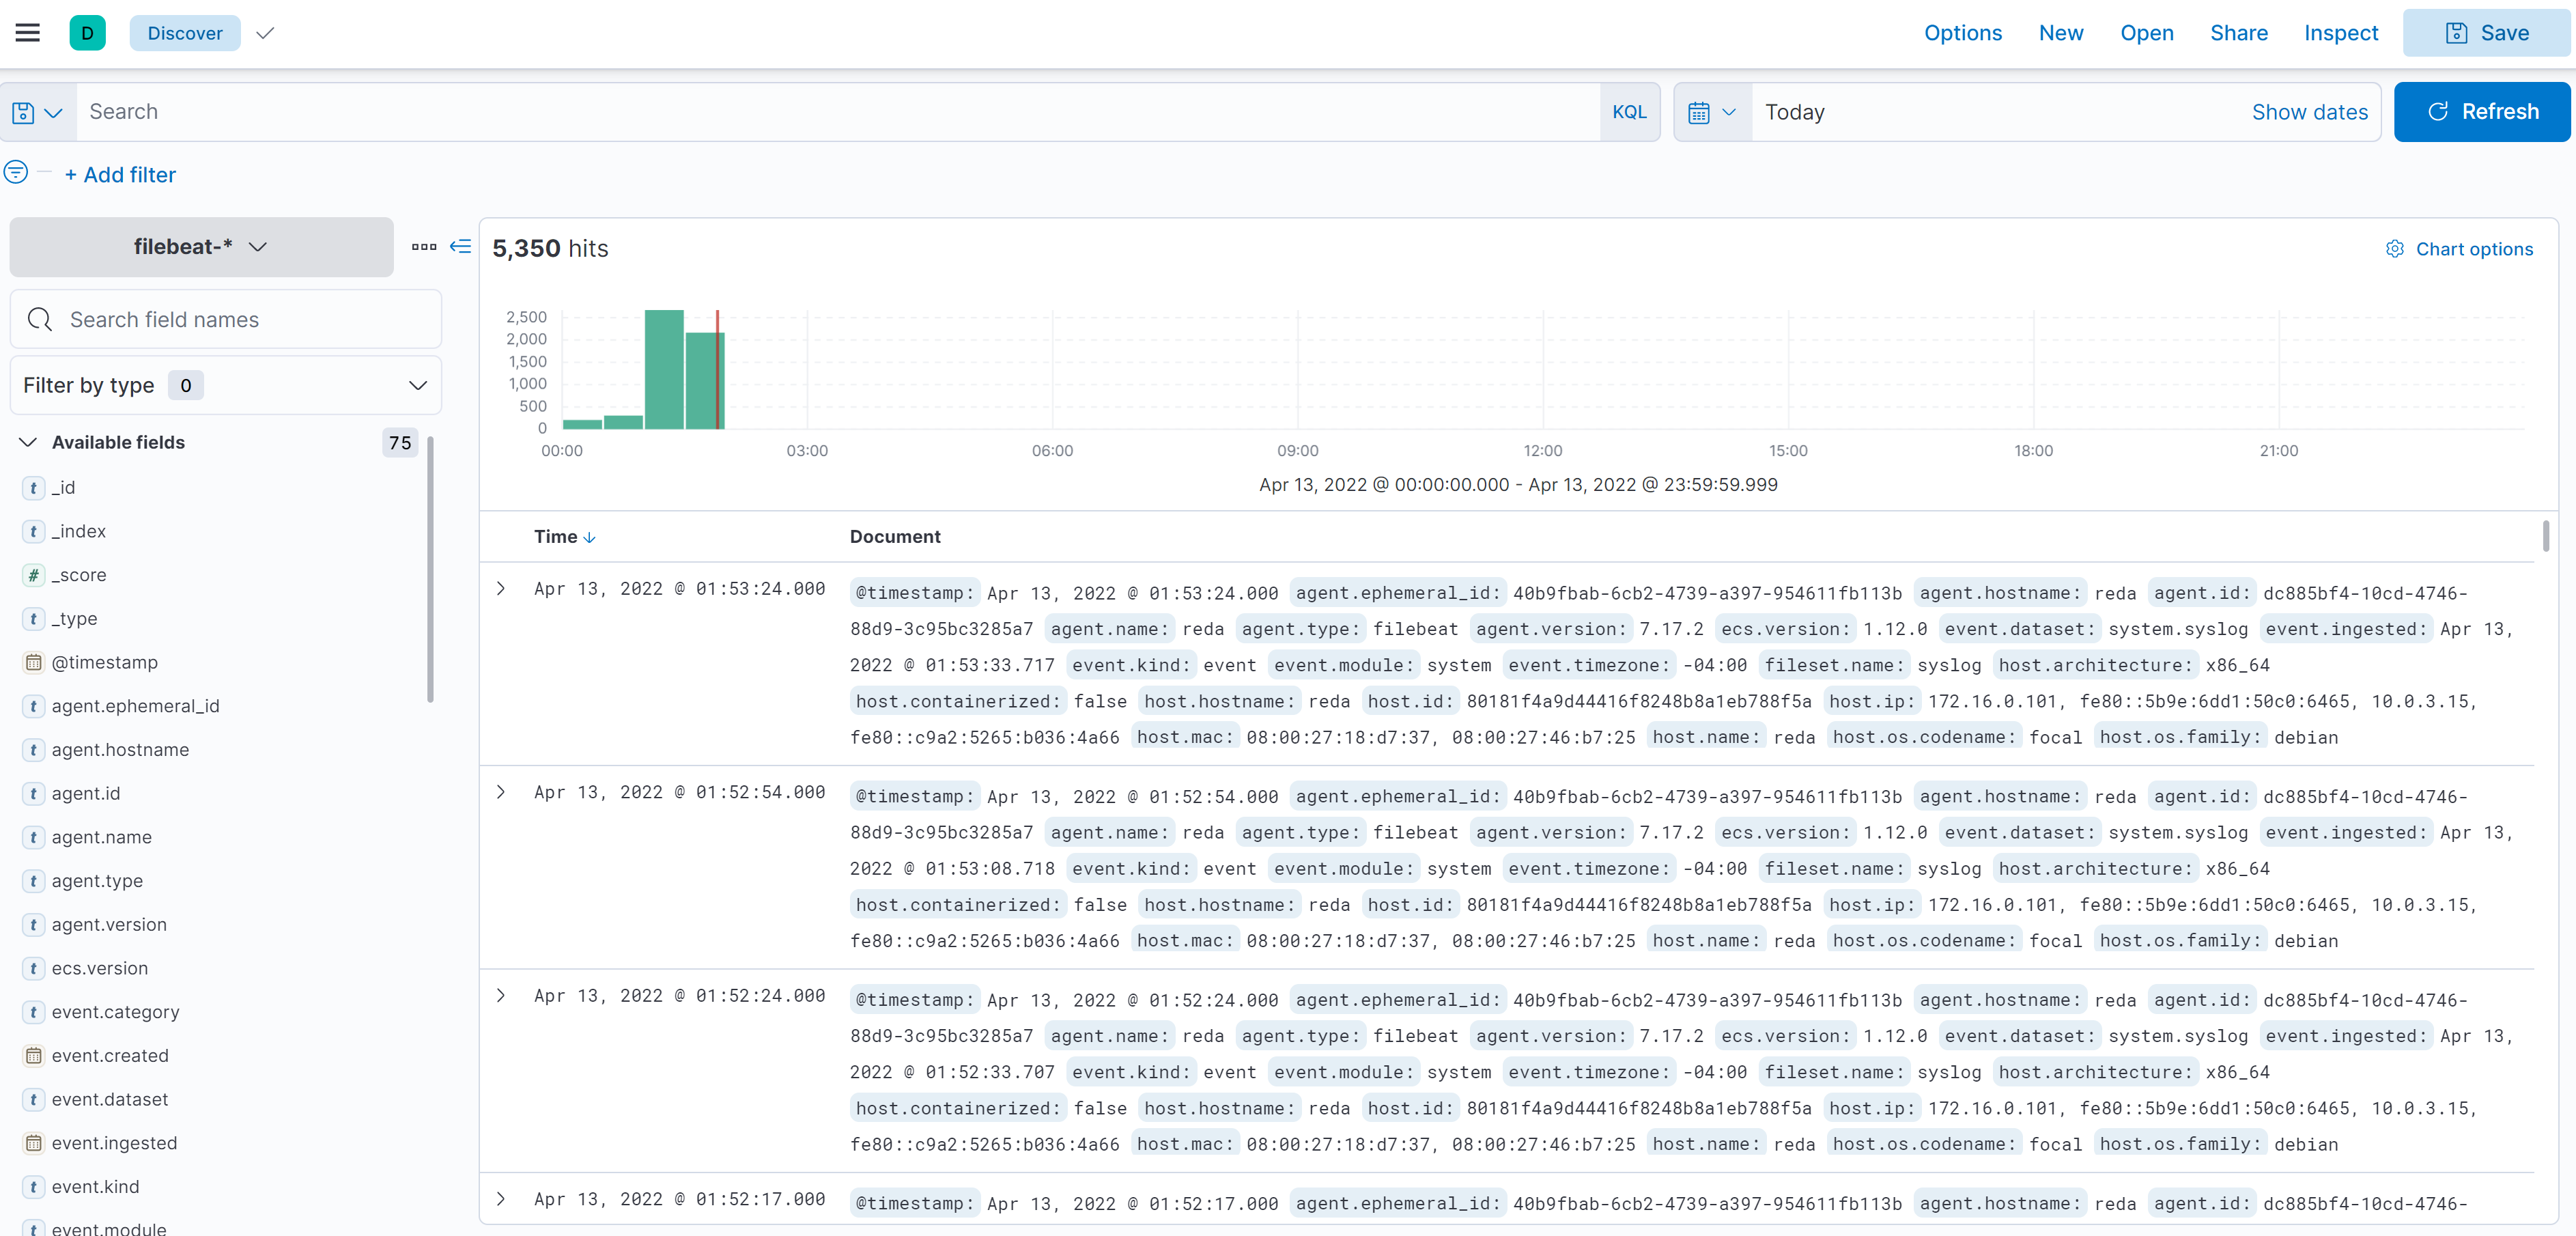
And now we can see some data reaching our Kibana Discovery pannel from Filebeat:
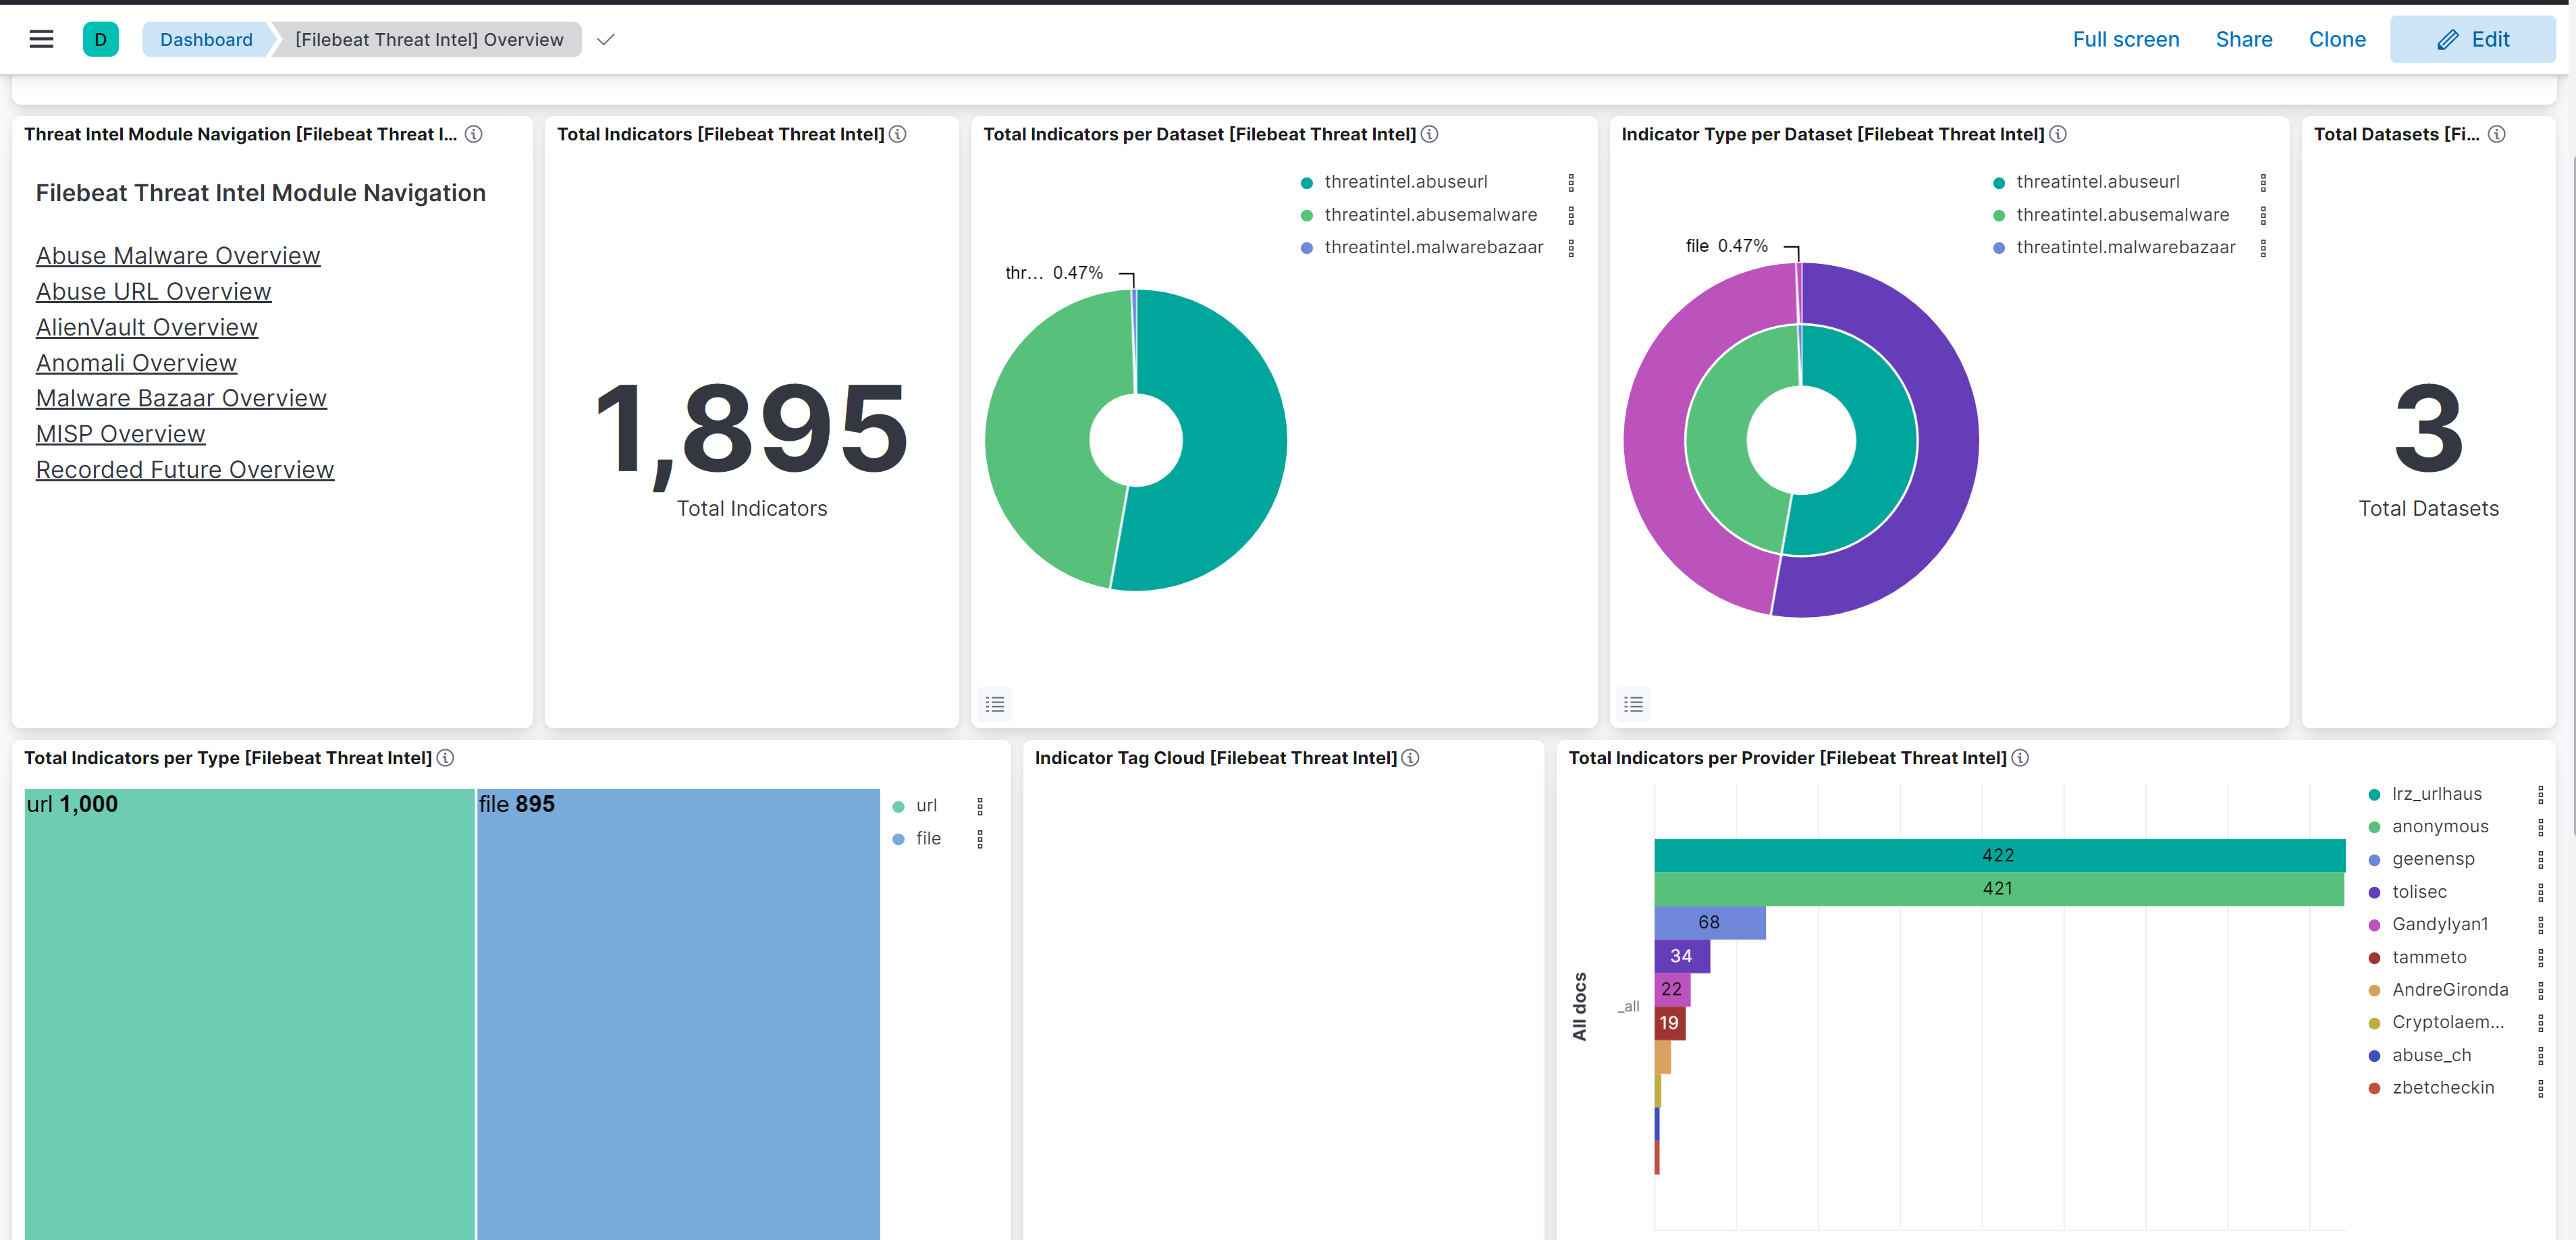
And Also see some Dashboard related to Filebeat Threat Intel:
First Scenario : Collecting Data From Windows 10 using beats
Enabling PowerShell Script Block Logging on Windows Victim Machine
function Enable-PSScriptBlockLogging
{
    $basePath = 'HKLM:\Software\Policies\Microsoft\Windows' +
      '\PowerShell\ScriptBlockLogging'

    if(-not (Test-Path $basePath))
    {
        $null = New-Item $basePath -Force
    }

    Set-ItemProperty $basePath -Name EnableScriptBlockLogging -Value "1"
}
Downloading WinLogBeat, PacketBeat and NPcap
Downloading the beats from :
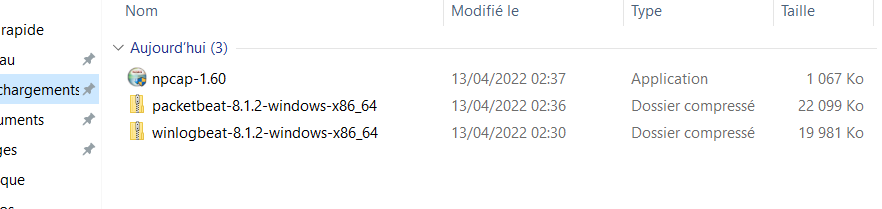
WinLogBeat
Winlogbeat is our lightweight shipper for Windows event logs. It installs and runs as a Windows service and ships event log data to Elasticsearch or Logstash.
First of all we need to extract our winlogbeat file into Program Files. Then:
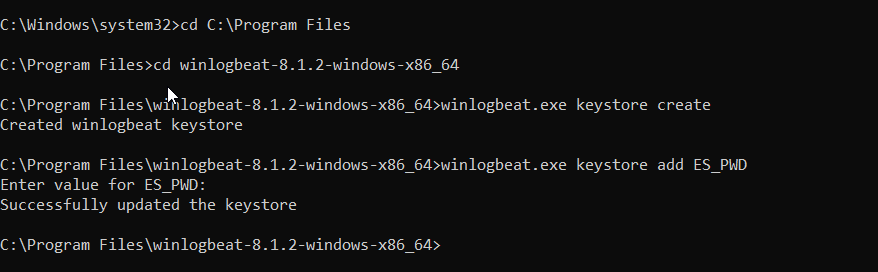
notepad.exe winlogbeat.ymlConfiguring winlogbeat
# ---------------------------- Kibana ----------------------------
setup.kibana:
    host: "172.16.0.101:5601"
...
# ---------------------------- Elasticsearch Output ----------------------------
output.elasticsearch:
  # Array of hosts to connect to.
  hosts: ["172.16.0.101:9200"]
...
  username: "elastic"
  password: "${ES_PWD}"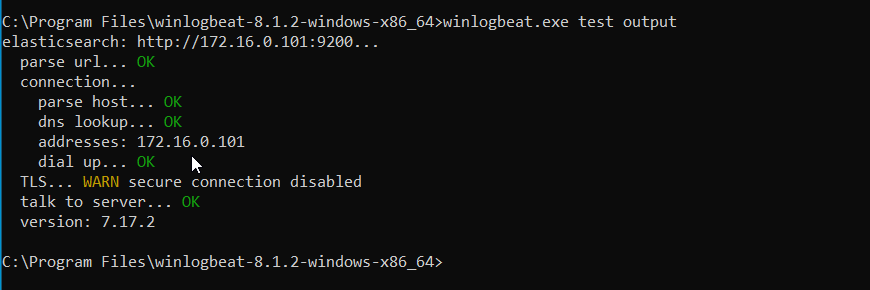
Setting-up the configuration
winlogbeat.exe setupActivate the service
powershell.exe -ExecutionPolicy UnRestricted -File .\install-service-winlogbeat.ps1Copy our secret password into ProgramData
md C:\ProgramData\winlogbeat\
copy data\winlogbeat.keystore C:\ProgramData\winlogbeat\
Next we have to start the service:
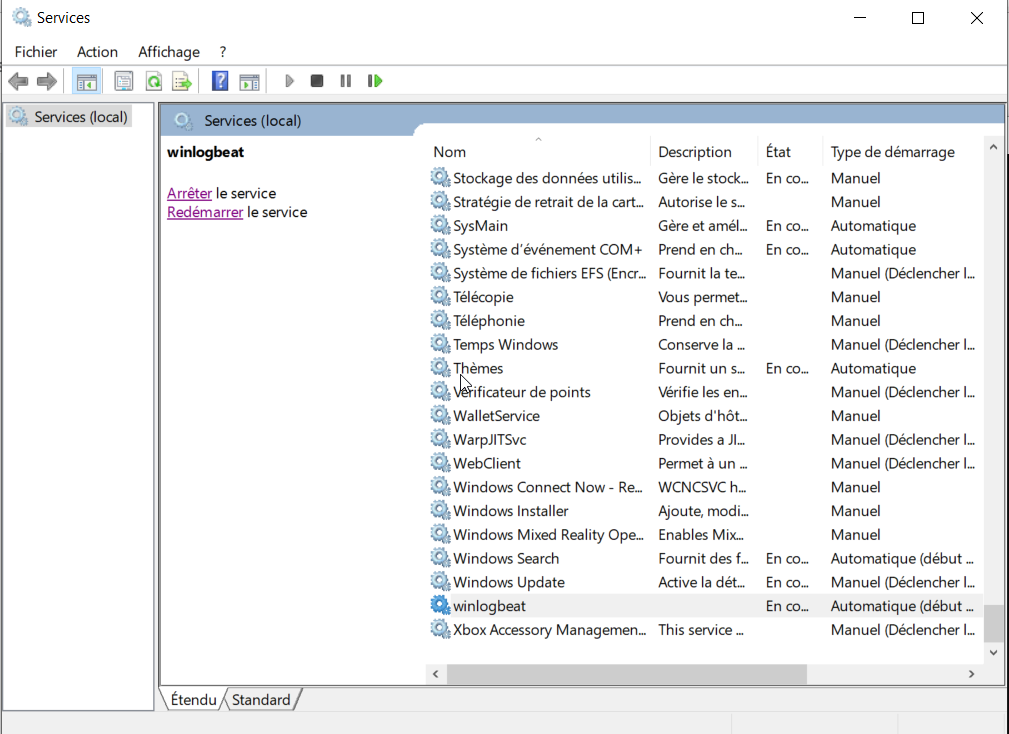
We run into an error:
Error: "No matching indices found: No indices match pattern "winlogbeat-*" KIBANA
and with some troubleshooting we run this command to see the logs in the local machine:
winlogbeat.exe -eThen we figure out that our Elasticsearch need to be upgraded so we decided to just allow older versions to get the logs by adding this line in the configuration:
output.elasticsearch.allow_older_versions: trueAfter we re-setup winlogbeat and restart the service:
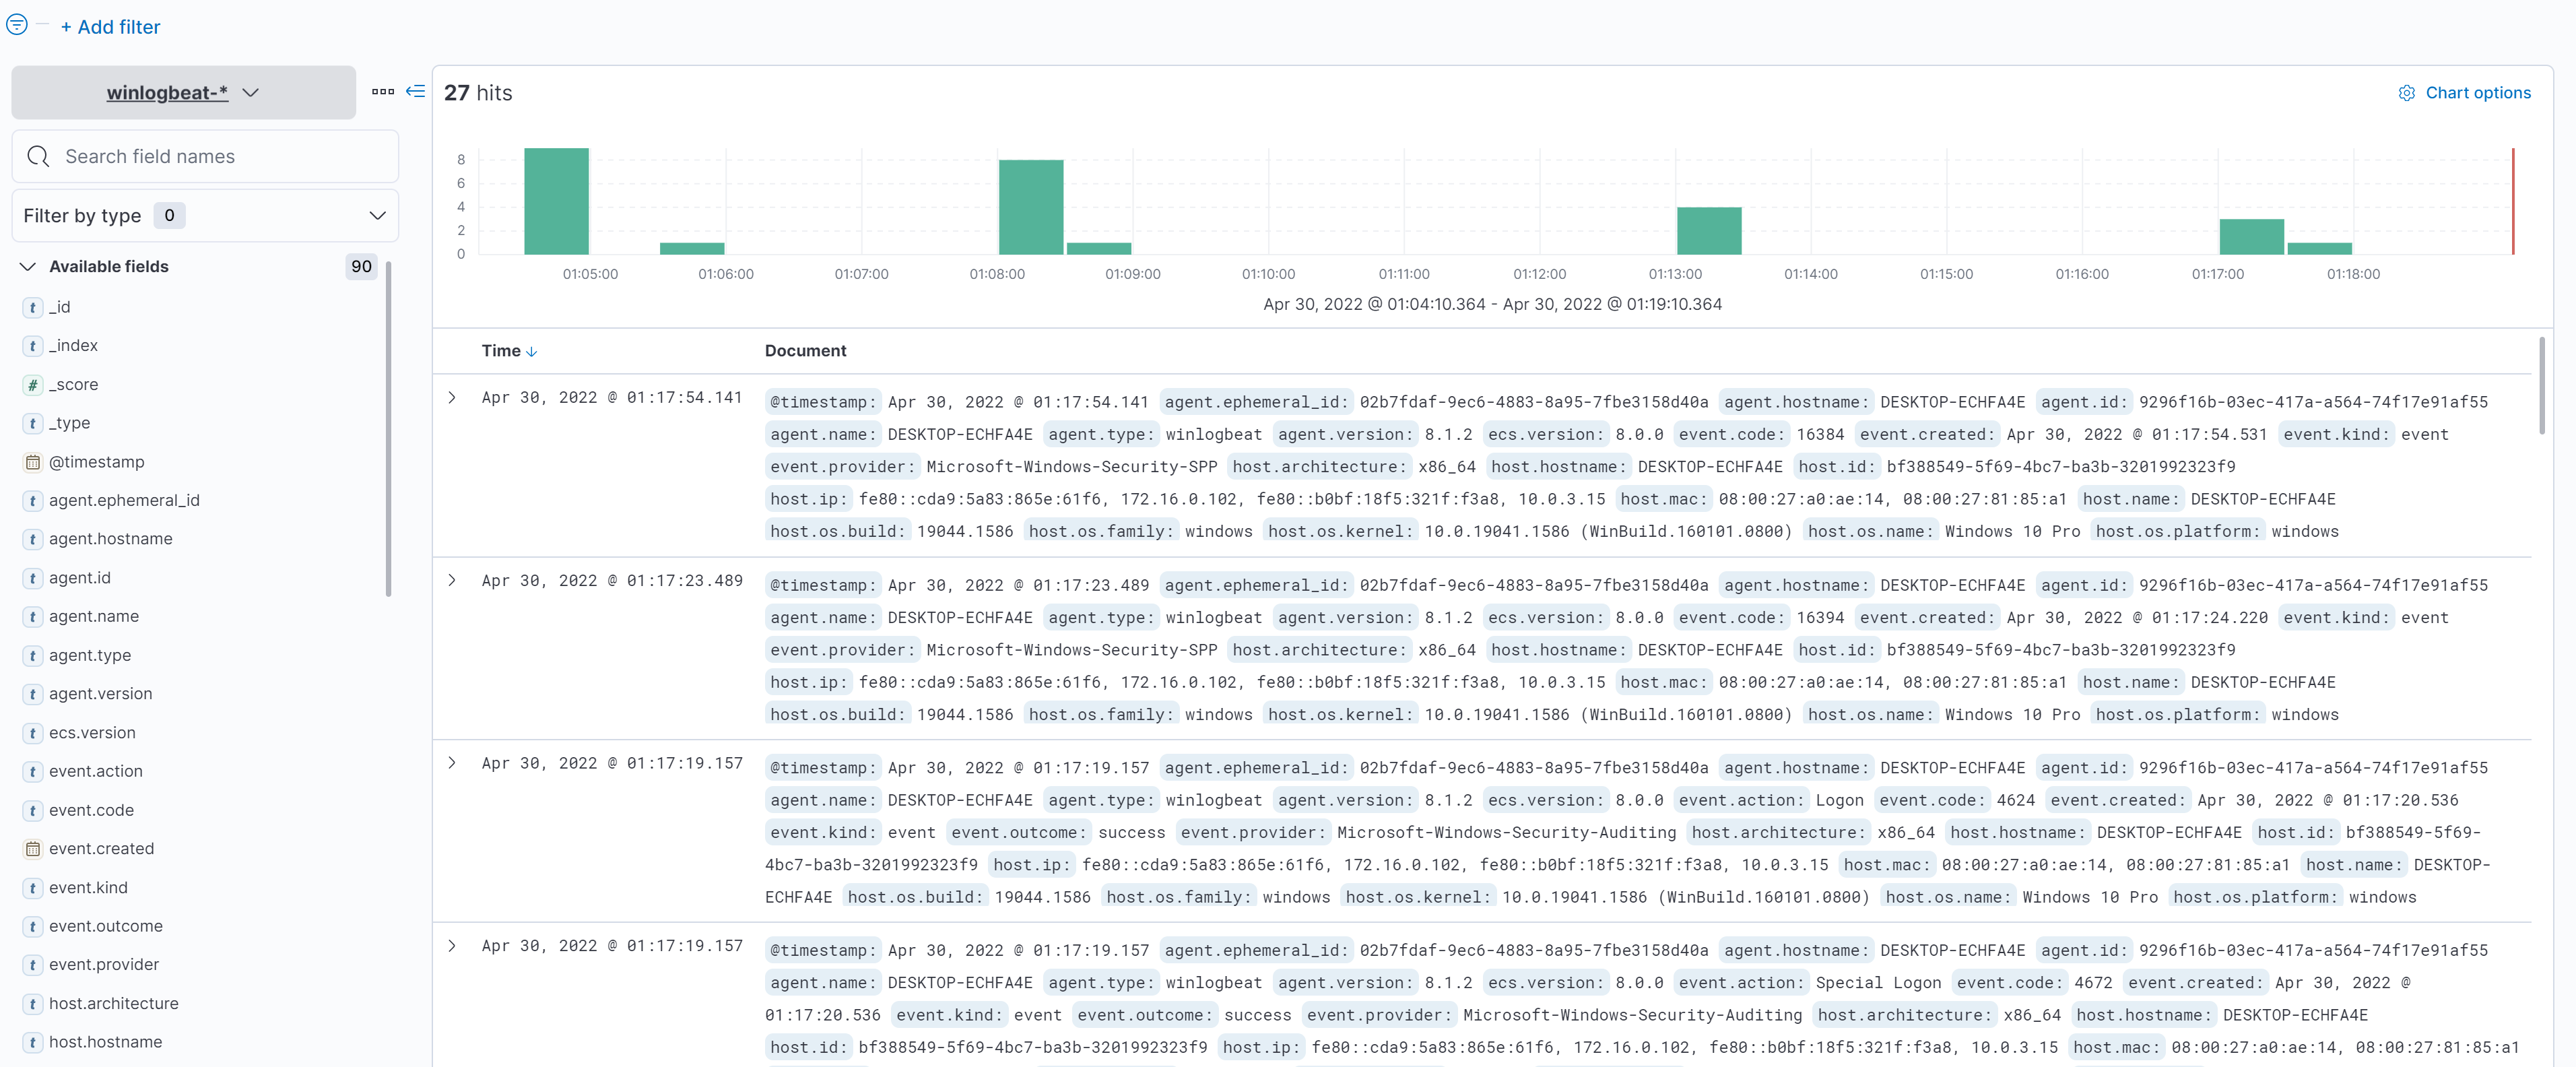
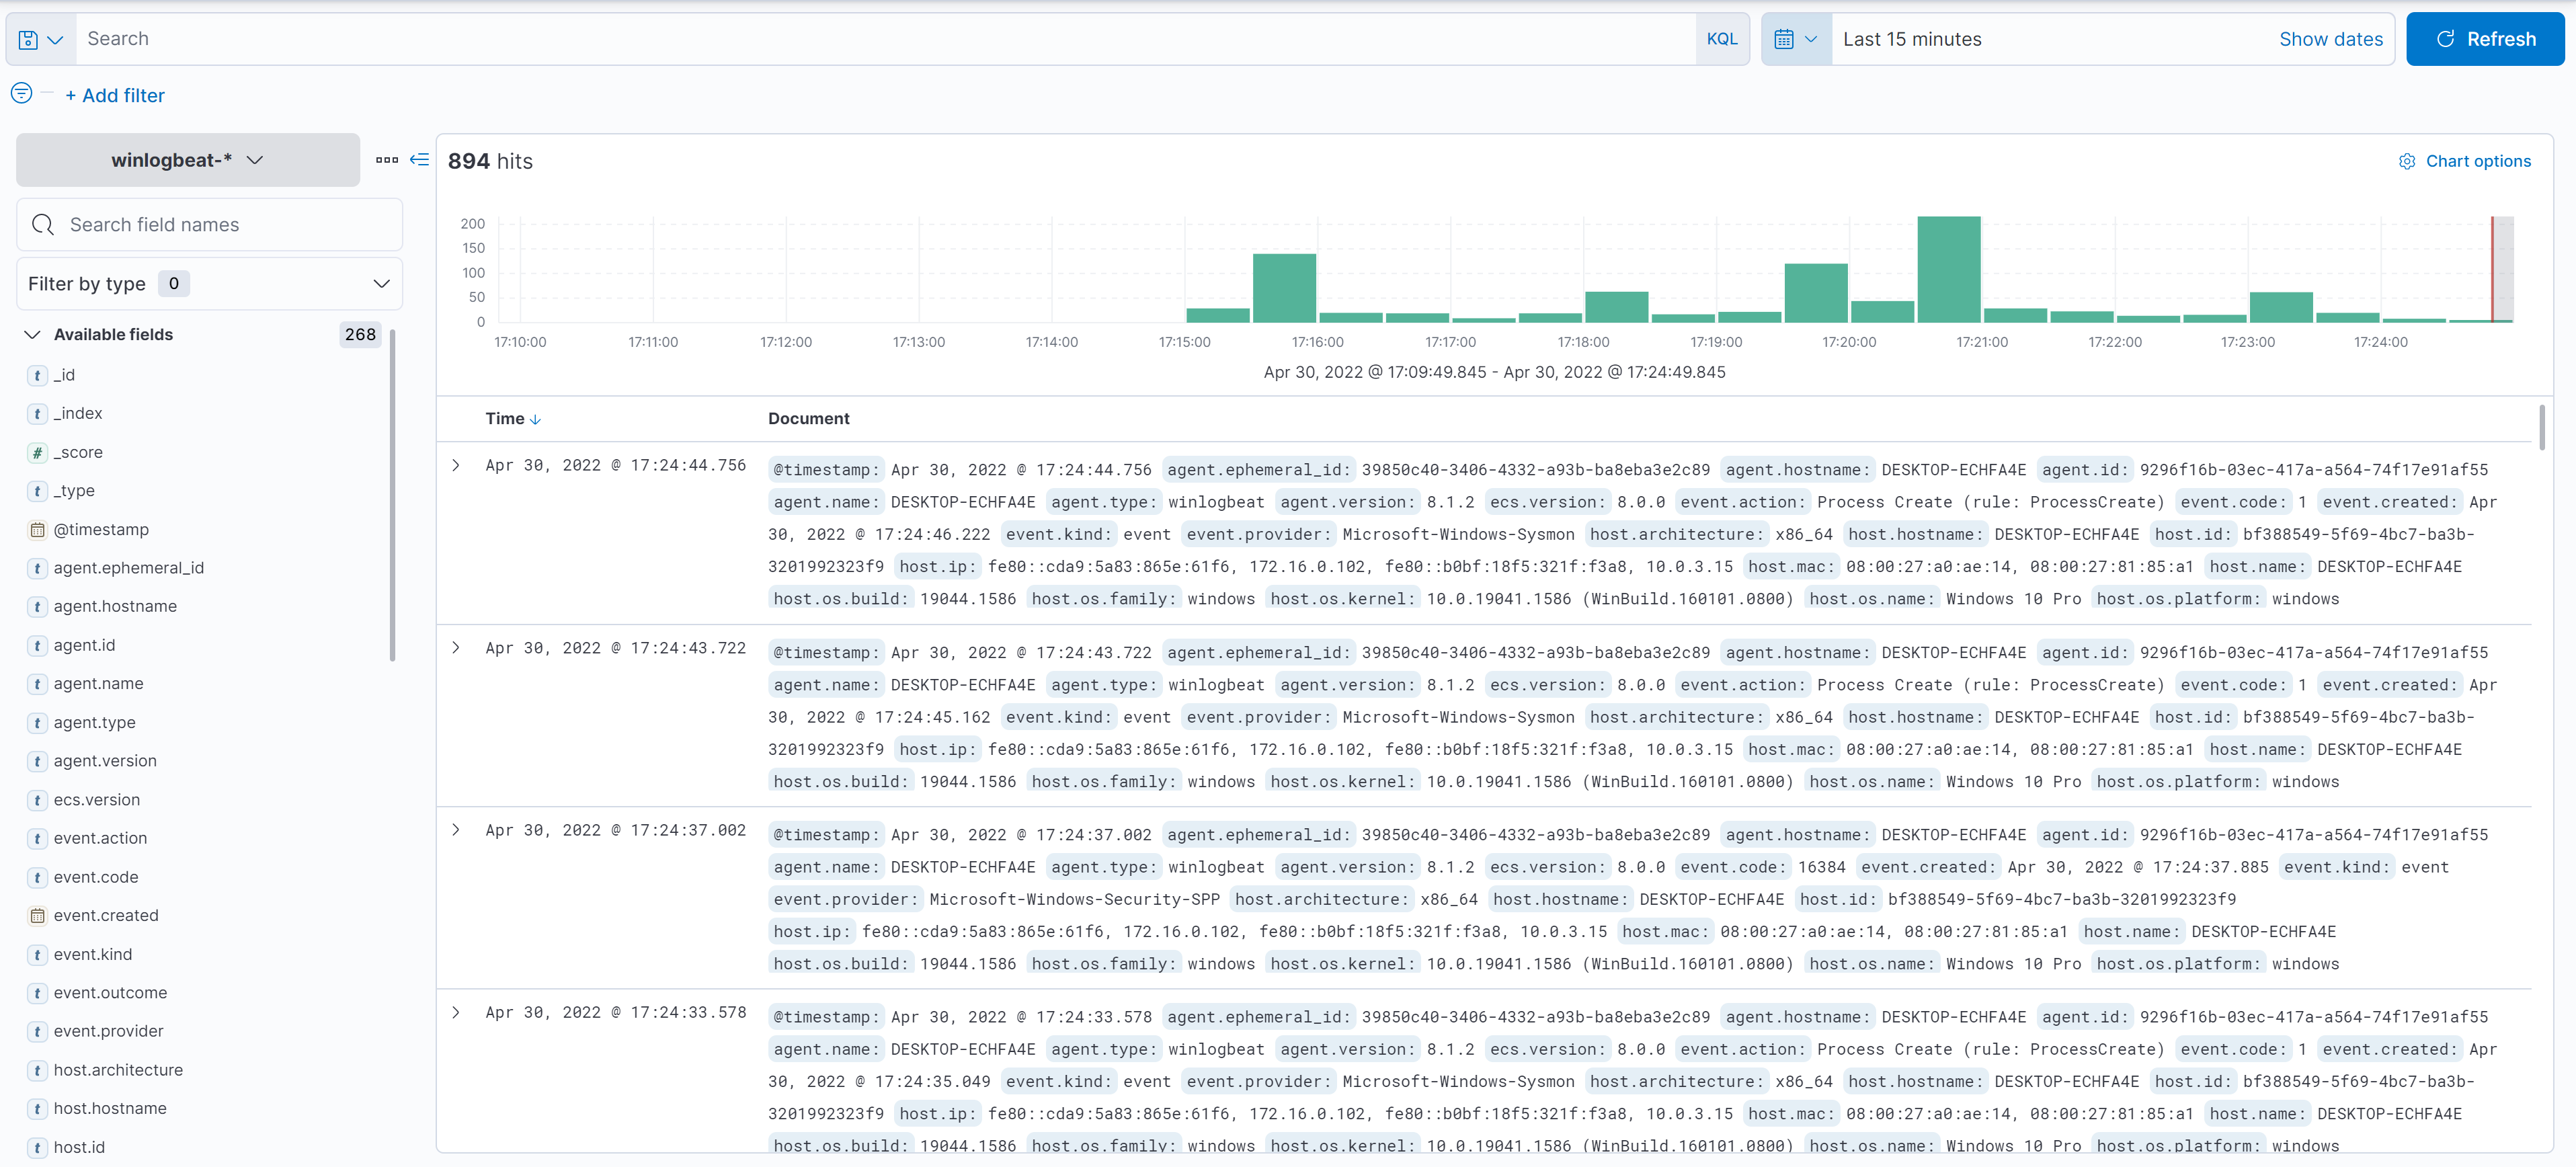
winlogbeat.exe setupAnd Now and finally we can see in the Discover panel the logs that we collect from our windows 10 victim machine:
PacketBeat and NPcap
Packetbeat is a real-time network packet analyzer that you can use with Elasticsearch to provide an application monitoring and performance analytics system. Packetbeat completes the Beats platform by providing visibility between the servers of your network.
Npcap is an architecture for packet capture and network analysis for Windows operating systems, consisting of a software library and a network driver. Most networking applications access the network through widely-used operating system primitives such as sockets.
First we need to install and follow the default installation of NPcap then we will add our extracted packetbeat folder into our Program Files. Then configure it:
packetbeat.exe keystroke create
packetbeat.exe keystroke add ES_PWD
notepad.exe packetbeat.yml
Configuring packetbeat:
packetbeat.interfaces.device: 0
# ---------------------------- Kibana ----------------------------
setup.kibana:
    host: "172.16.0.101:5601"
...
# ---------------------------- Elasticsearch Output ----------------------------
output.elasticsearch:
  # Array of hosts to connect to.
  hosts: ["172.16.0.101:9200"]
...
  username: "elastic"
  password: "${ES_PWD}"
to see the list of the devices and network interfaces that are in our local machine we type:

Setting-up the configuration
packetbeat.exe setupActivate the service
powershell.exe -ExecutionPolicy UnRestricted -File .\install-service-packetbeat.ps1Copy our secret password into ProgramData
md C:\ProgramData\packetbeat\
copy data\packetbeat.keystore C:\ProgramData\packetbeat\
Next we have to start the service:
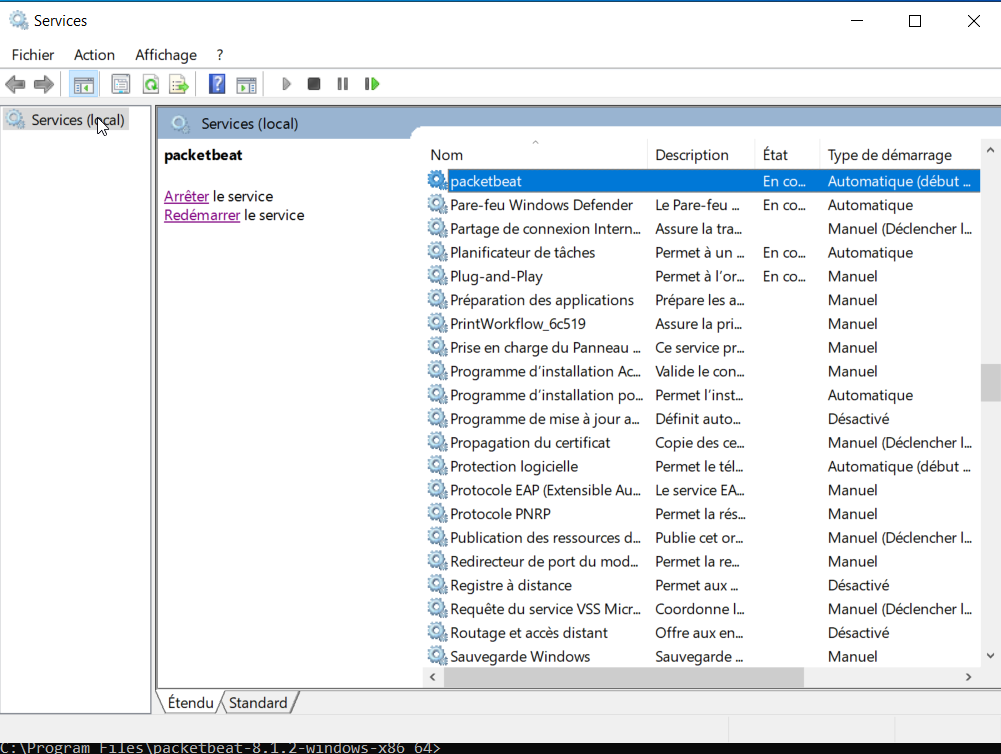
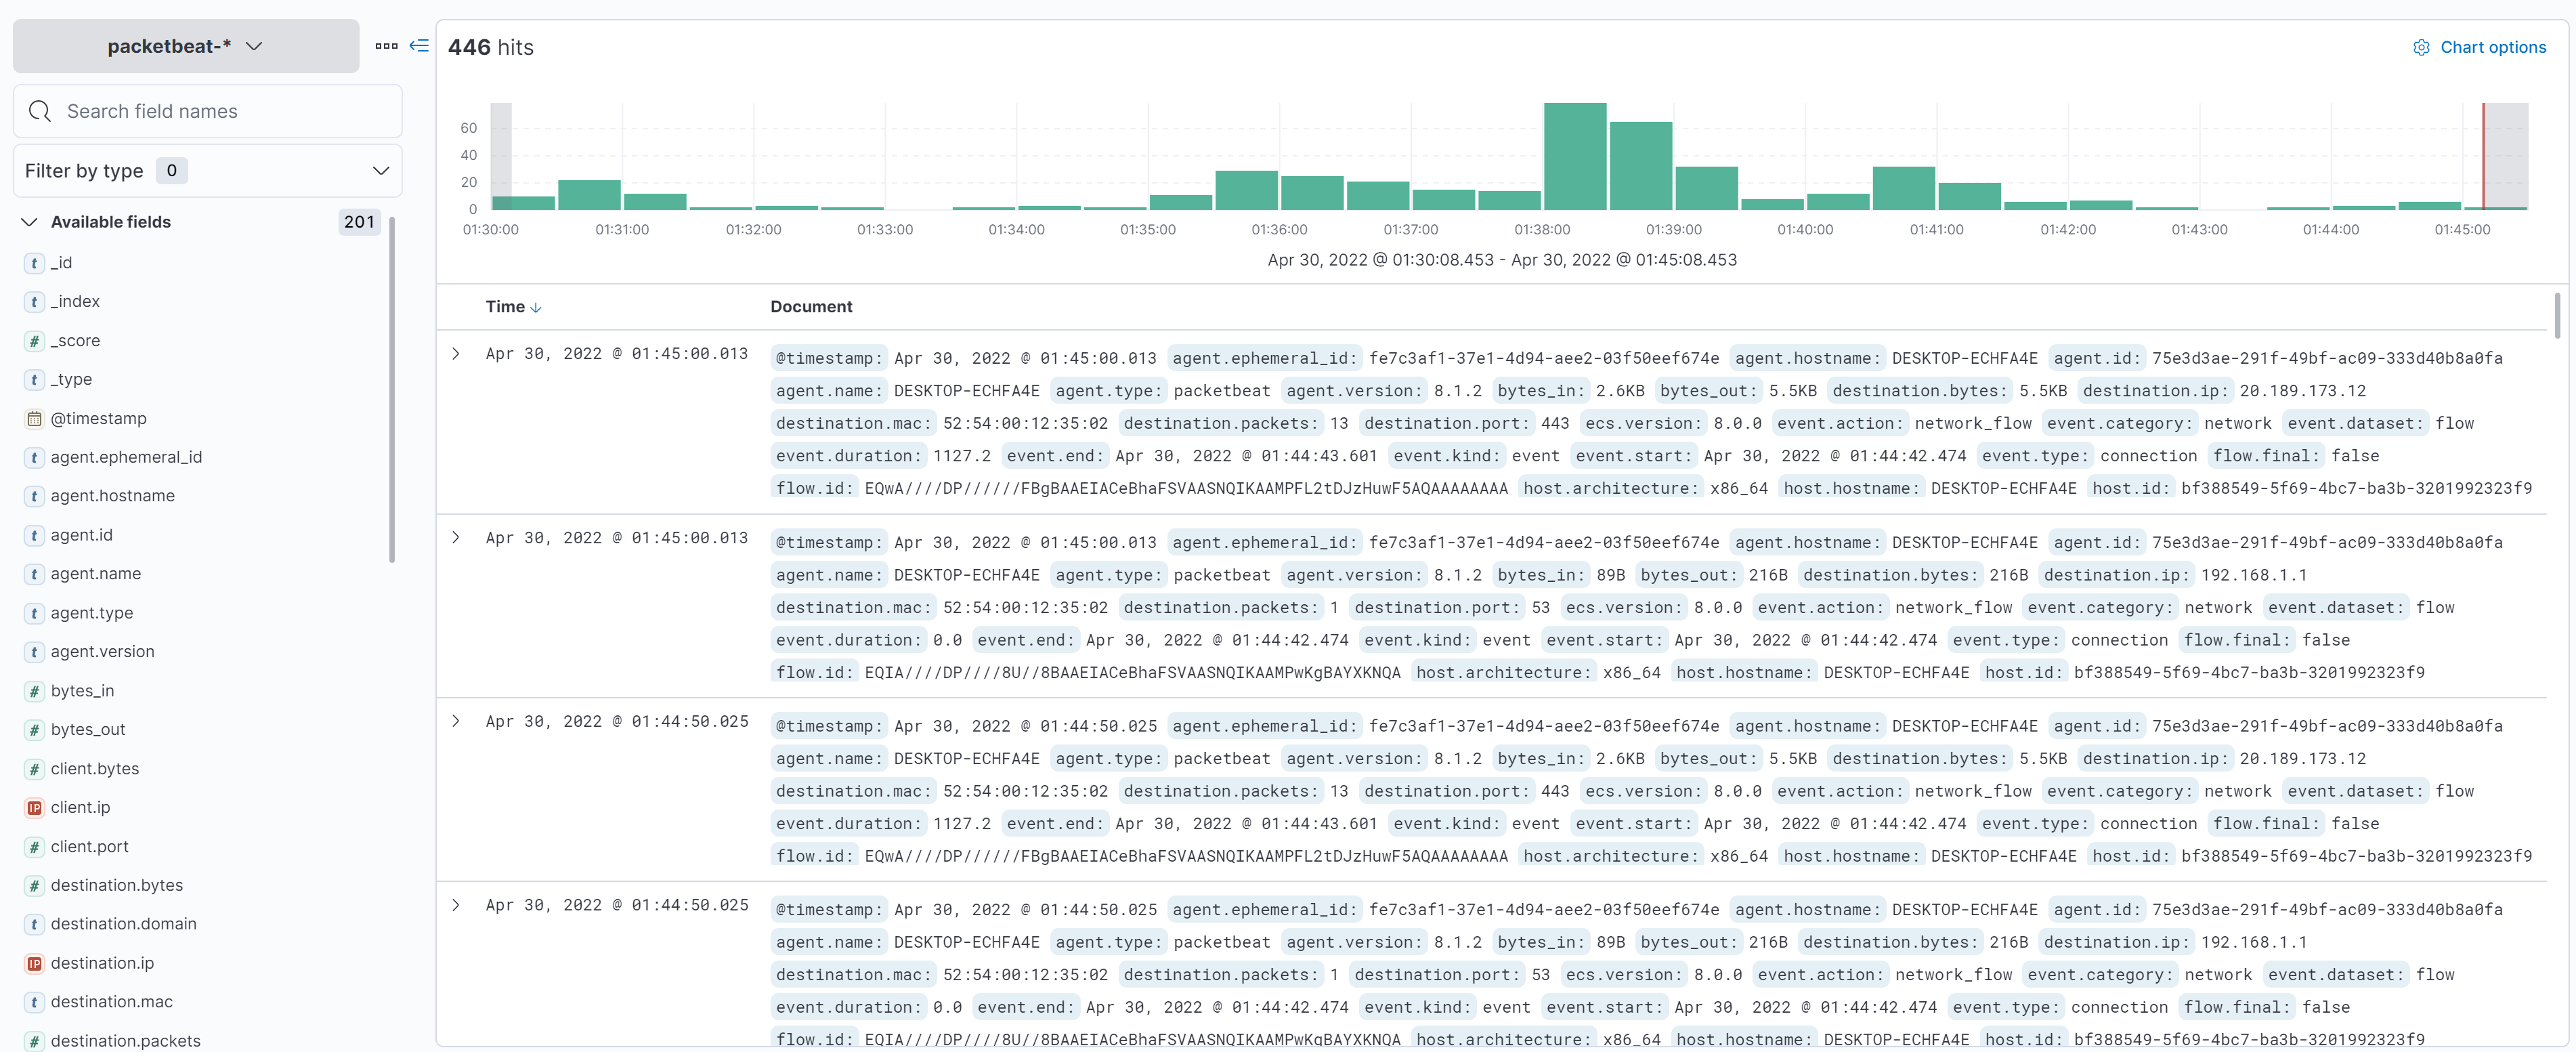
And now we can see the data in Kibana:
Second Scenario : Collecting Data From Windows 10 using Sysmon and Elastic-Agents
Downloading Microsoft Sysmon
System Monitor (Sysmon) is a Windows system service and device driver that, once installed on a system, remains resident across system reboots to monitor and log system activity to the Windows event log. It provides detailed information about process creations, network connections, and changes to file creation time.
https://docs.microsoft.com/en-us/sysinternals/downloads/sysmon
Configuring Sysmon for Endpoint Collection
First we need to download a template configuration for our sysmon and the one that we choose is https://github.com/SwiftOnSecurity/sysmon-config
curl -OL https://github.com/SwiftOnSecurity/sysmon-config/blob/master/sysmonconfig-export.xml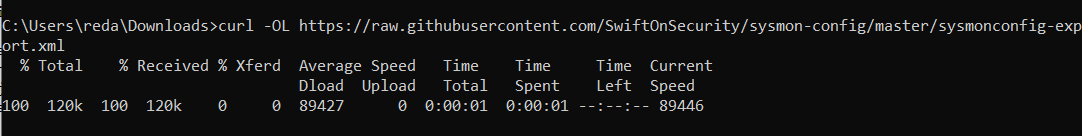
And then we can install sysmon
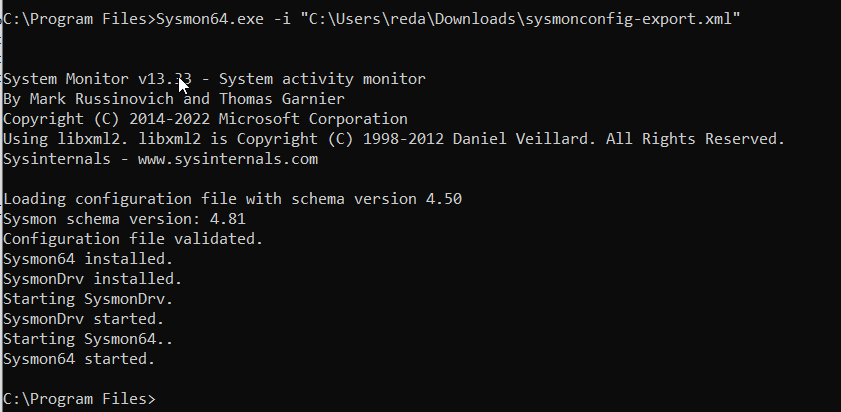
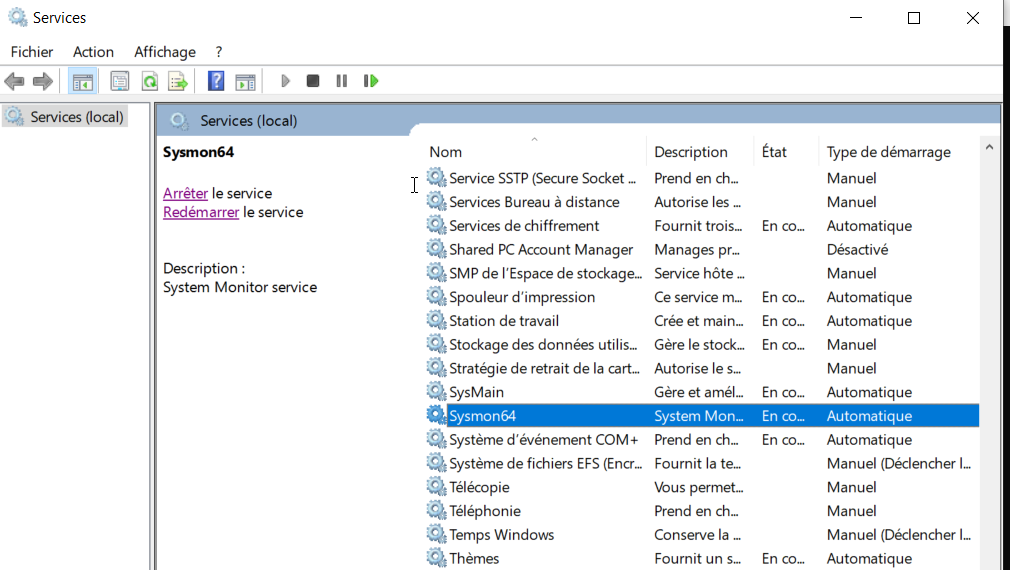
And it will automatically start our service
Configuring Elastic Agents
First we are going to create a new agent policy for windows system
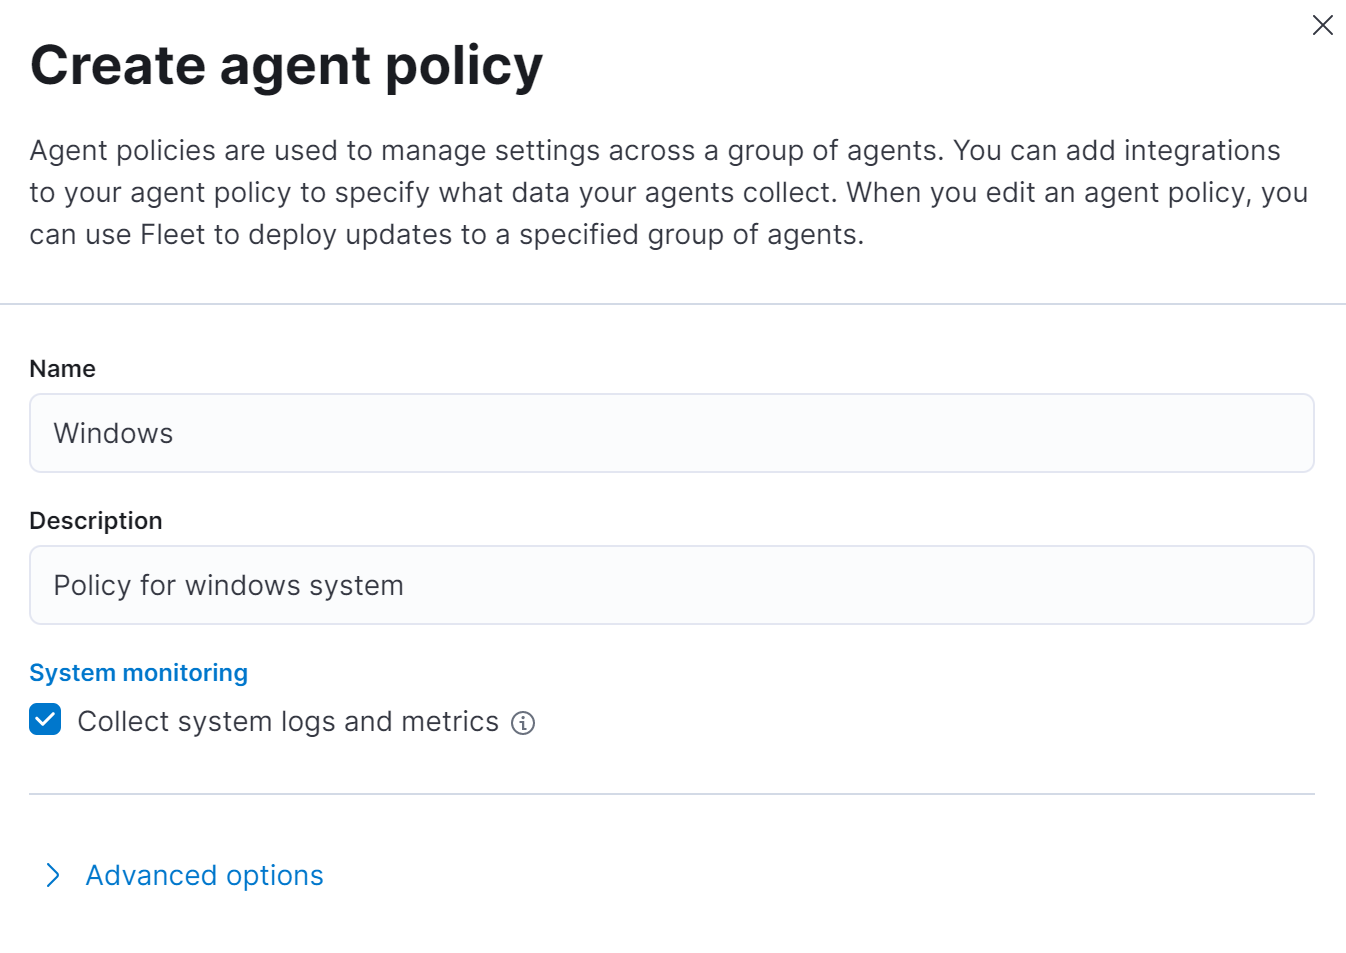
Windows Integration
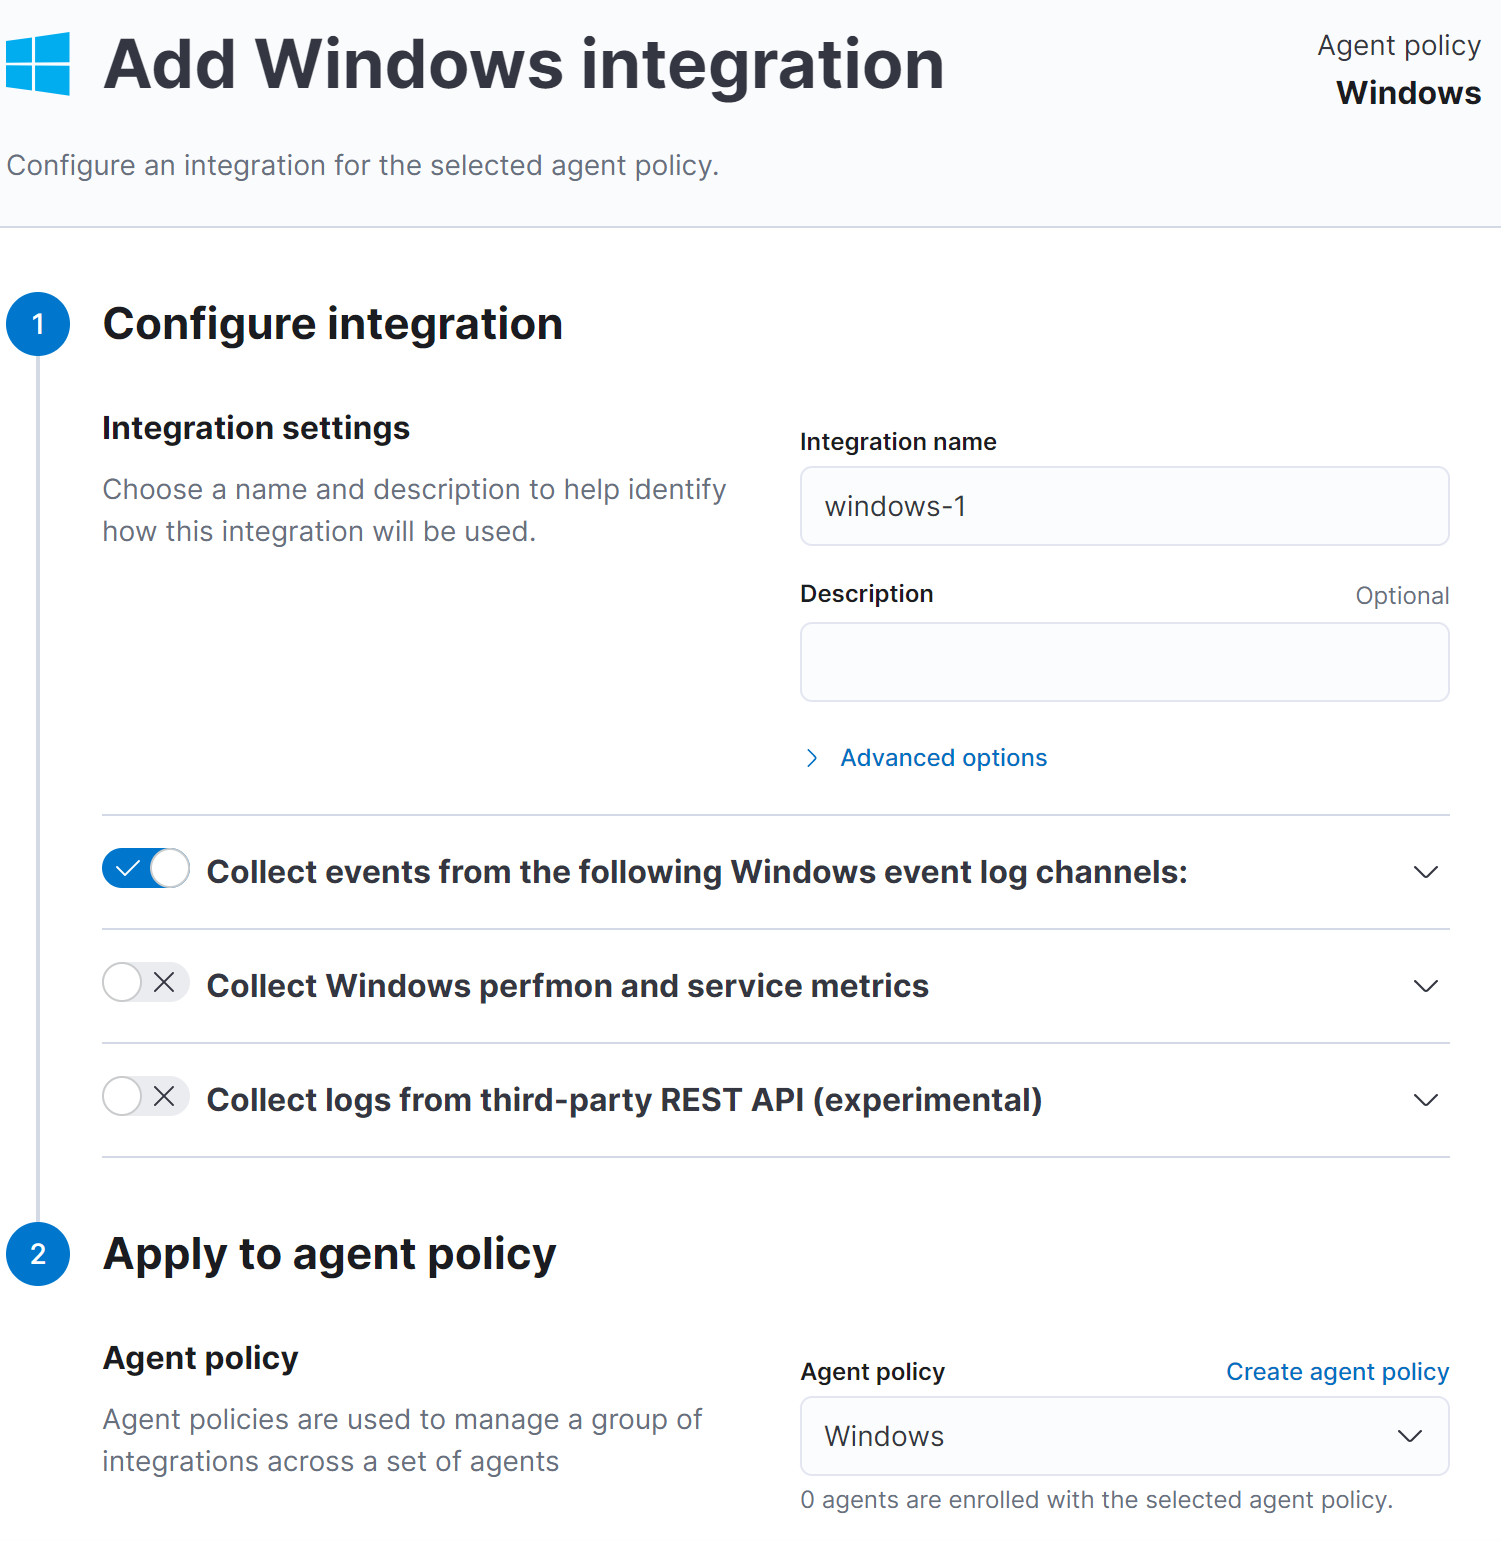
Next we will add windows integrations into our new policy
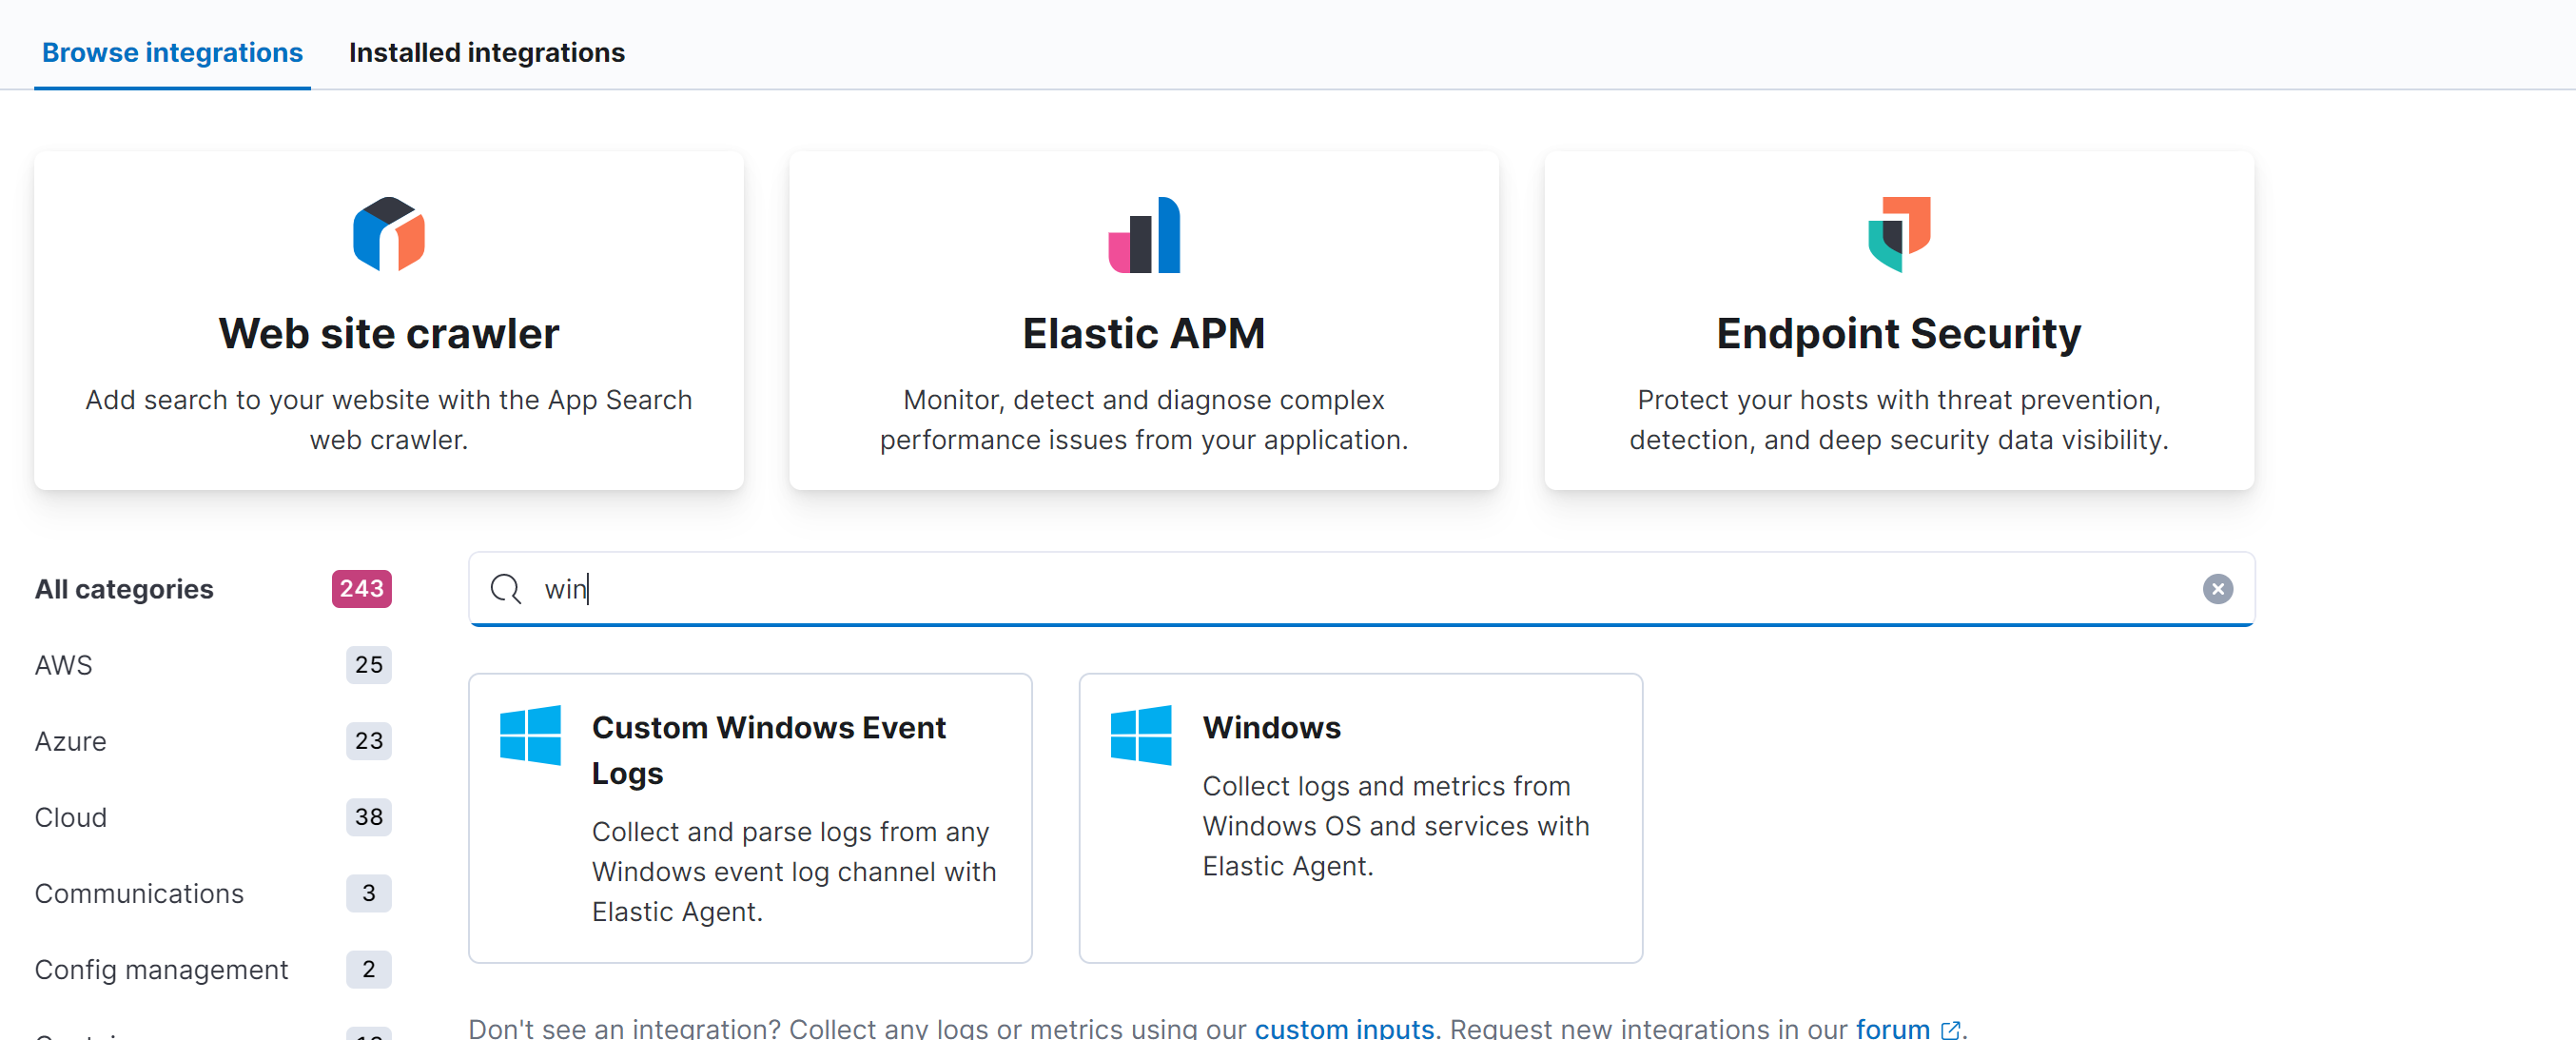
The Windows package allows you to monitor the Windows os, services, applications etc. Because the Windows integration always applies to the local server, the hosts config option is not needed.
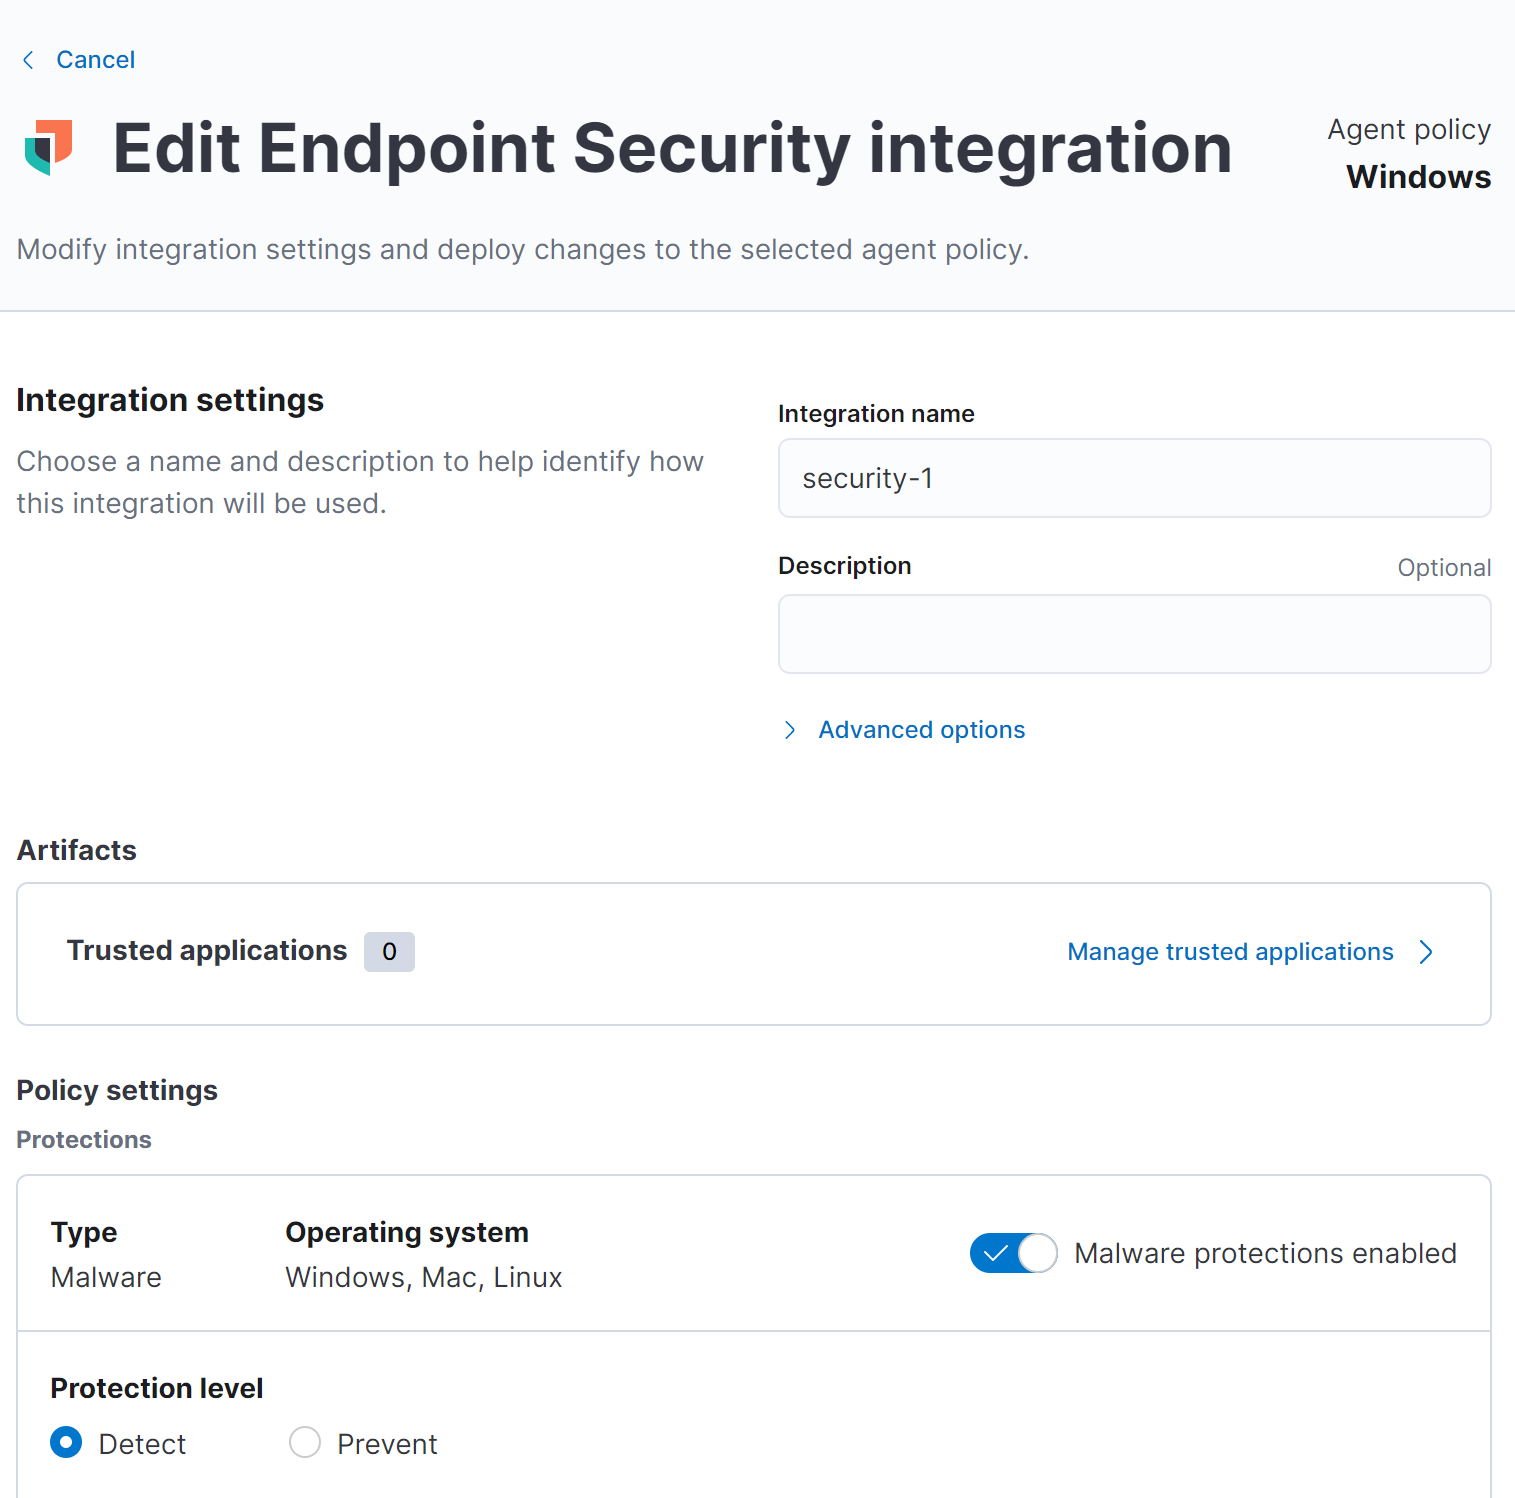
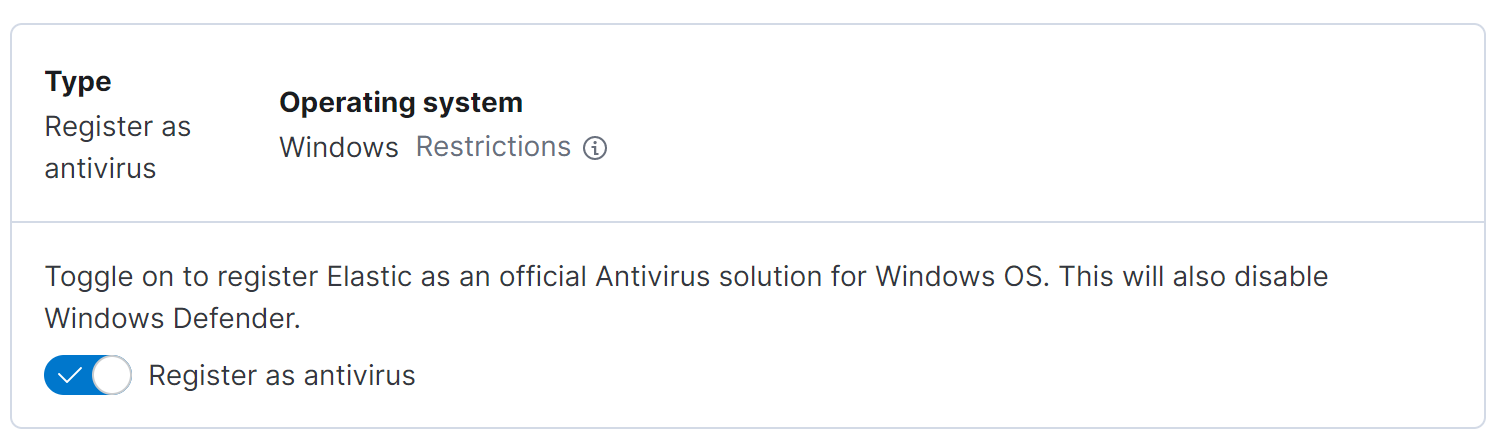
Endpoint Security Integration
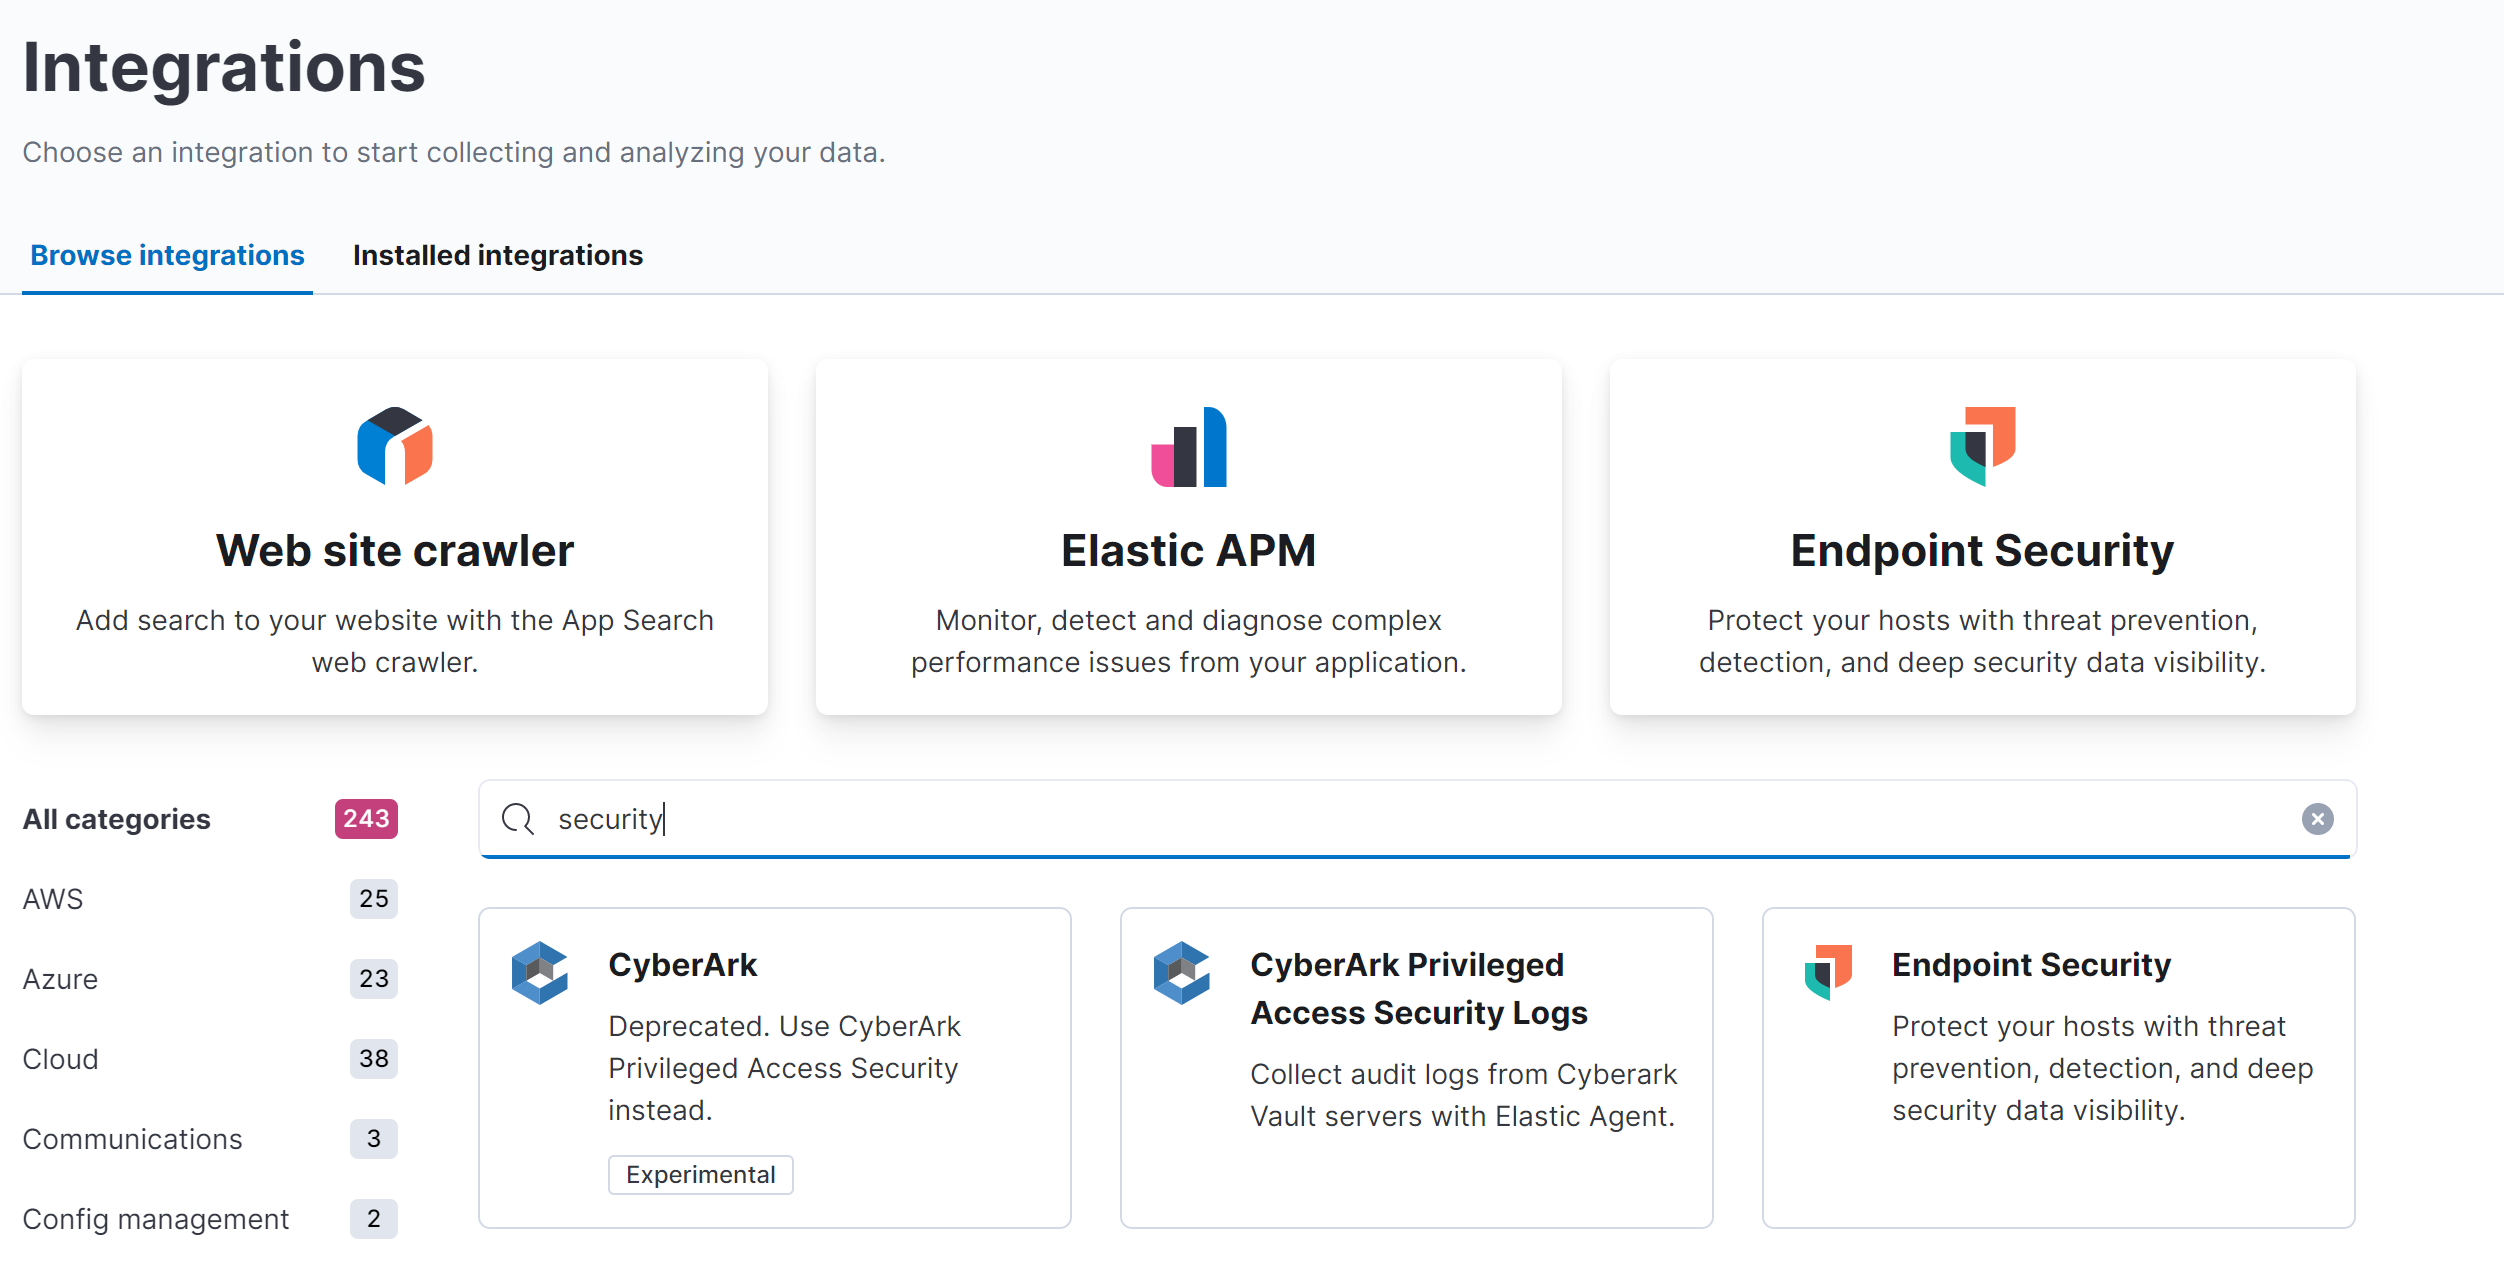
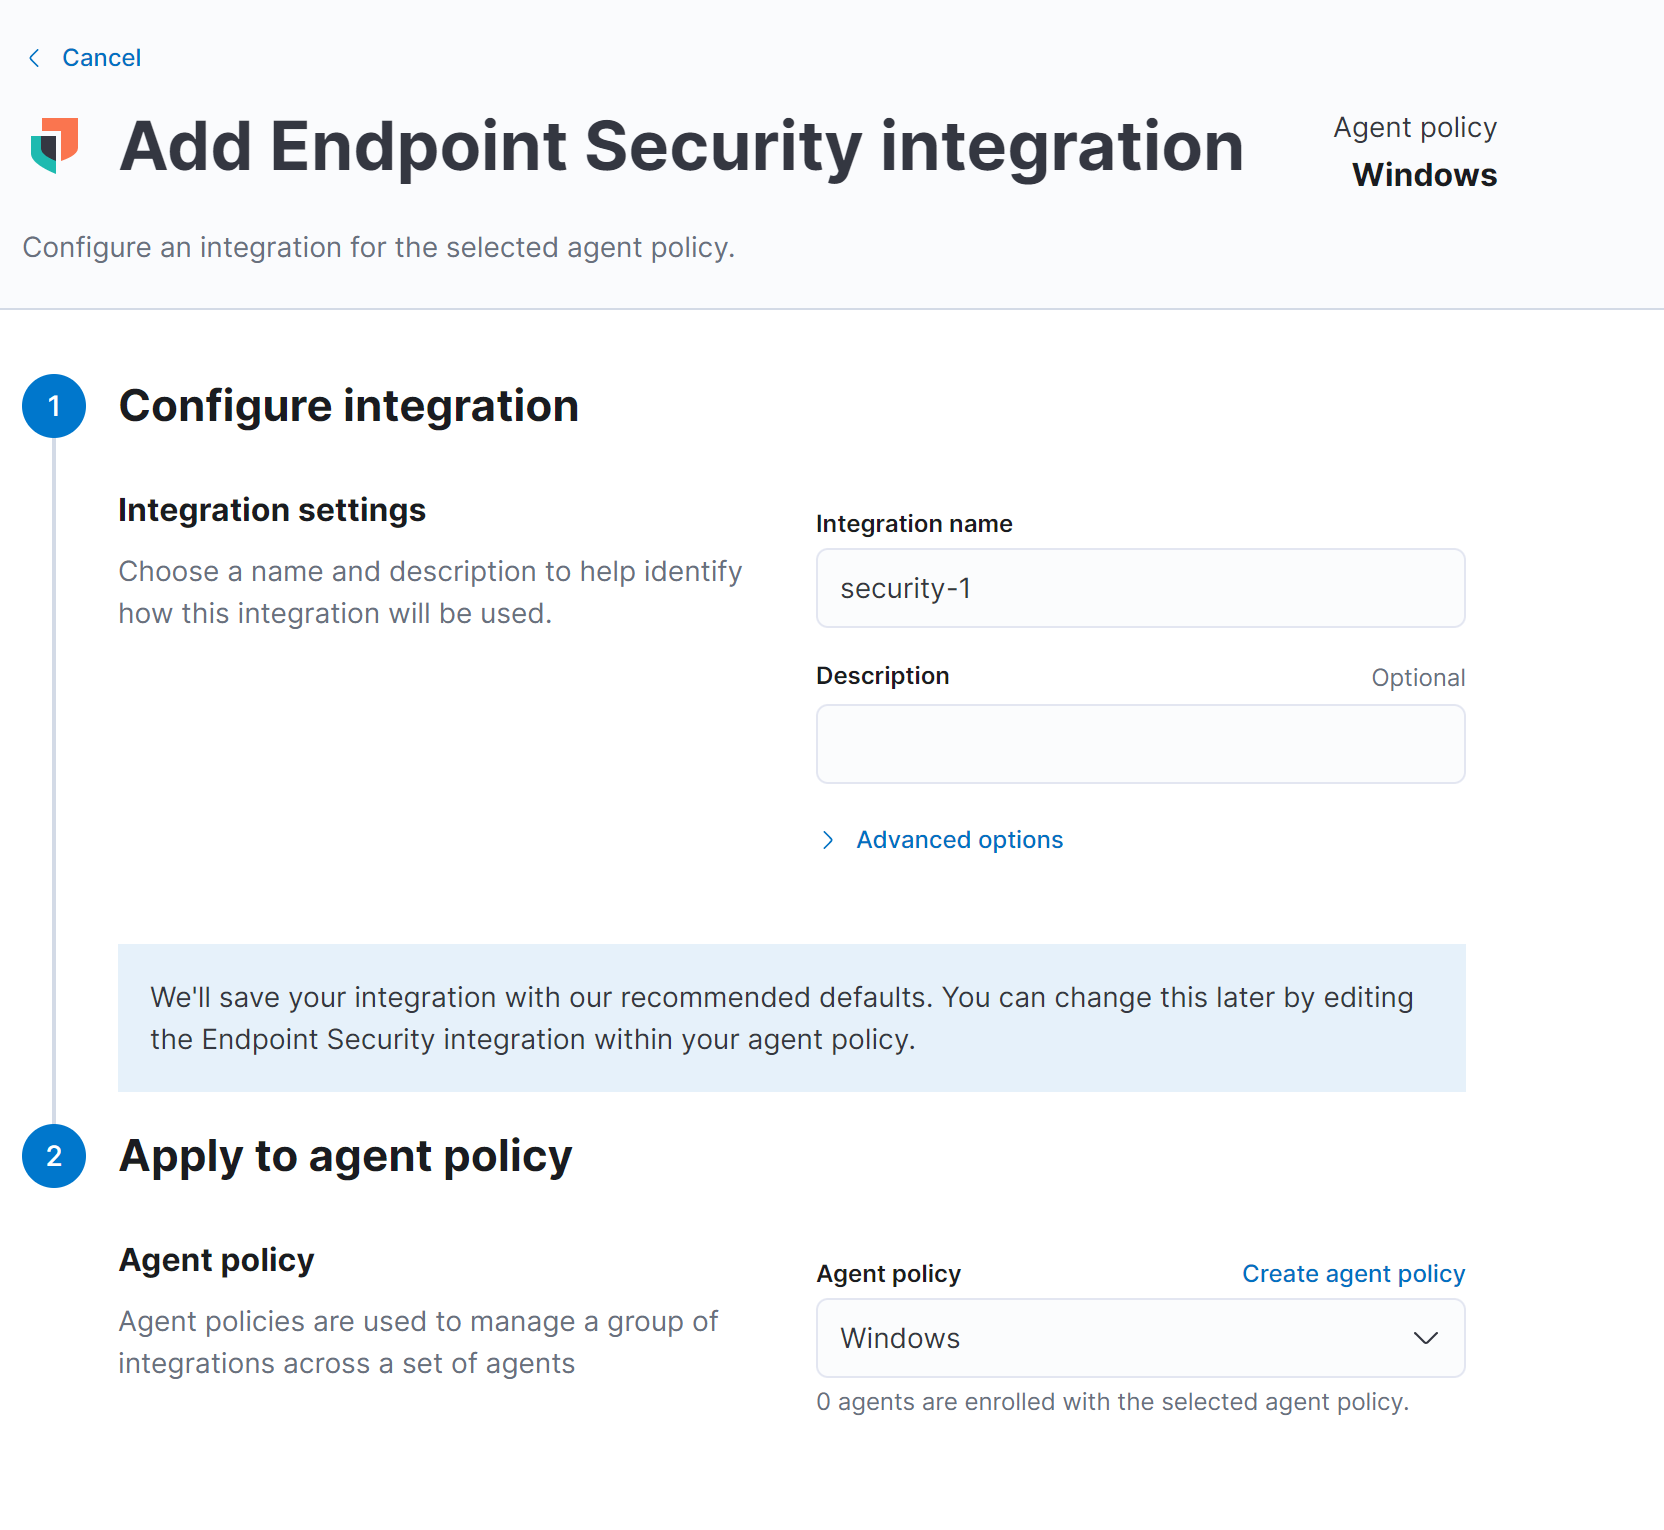
And now we need to edit the security integration
Deploying Elastic Agent
First of all we need to download elastic agent from elastic and then installing it using the url of the fleet server and the enrollment token (specific to our policy) given to us from kibana :
.\elastic-agent.exe install -f --url=https://172.16.0.101:8220 --enrollment-token=<TOKENT> --insecure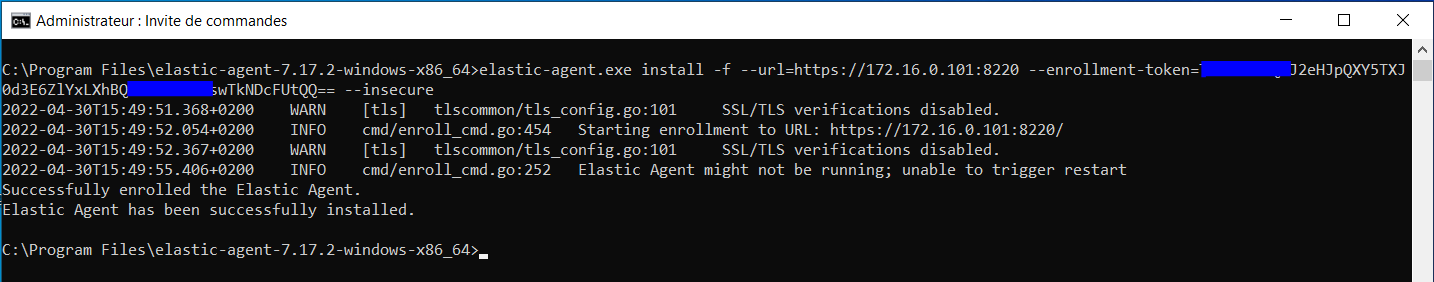
And now we can visualize our data that has been collected through our elastic agent
Example : URL Visualization
As an example we send a GET request to http://neverssl.com and https://neverssl.com
curl -L http://neverssl.com
curl -Lk https://neverssl.com
we use -k because the SSL certificates is not trusted
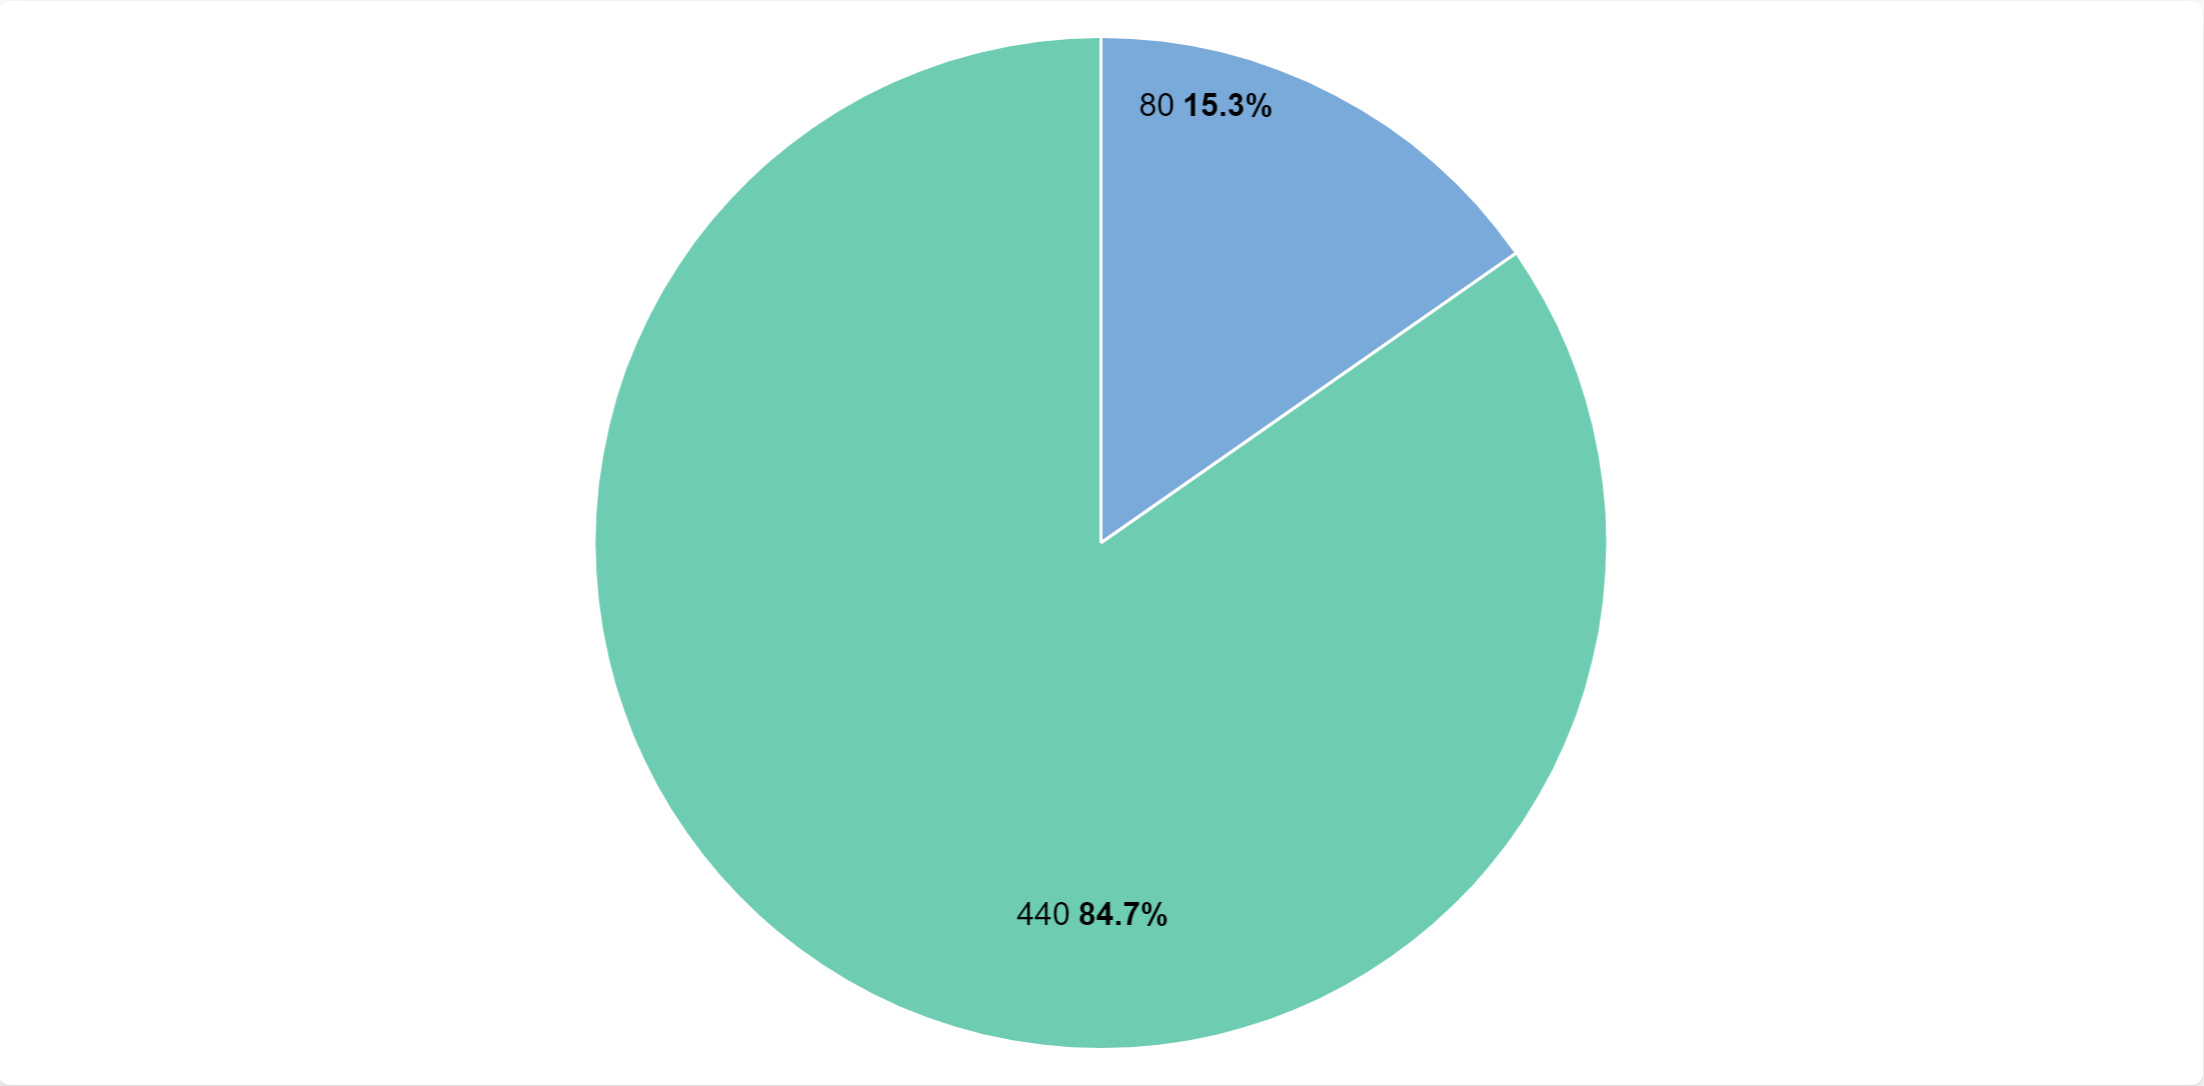
Now we can see how many requests we did to http or https website
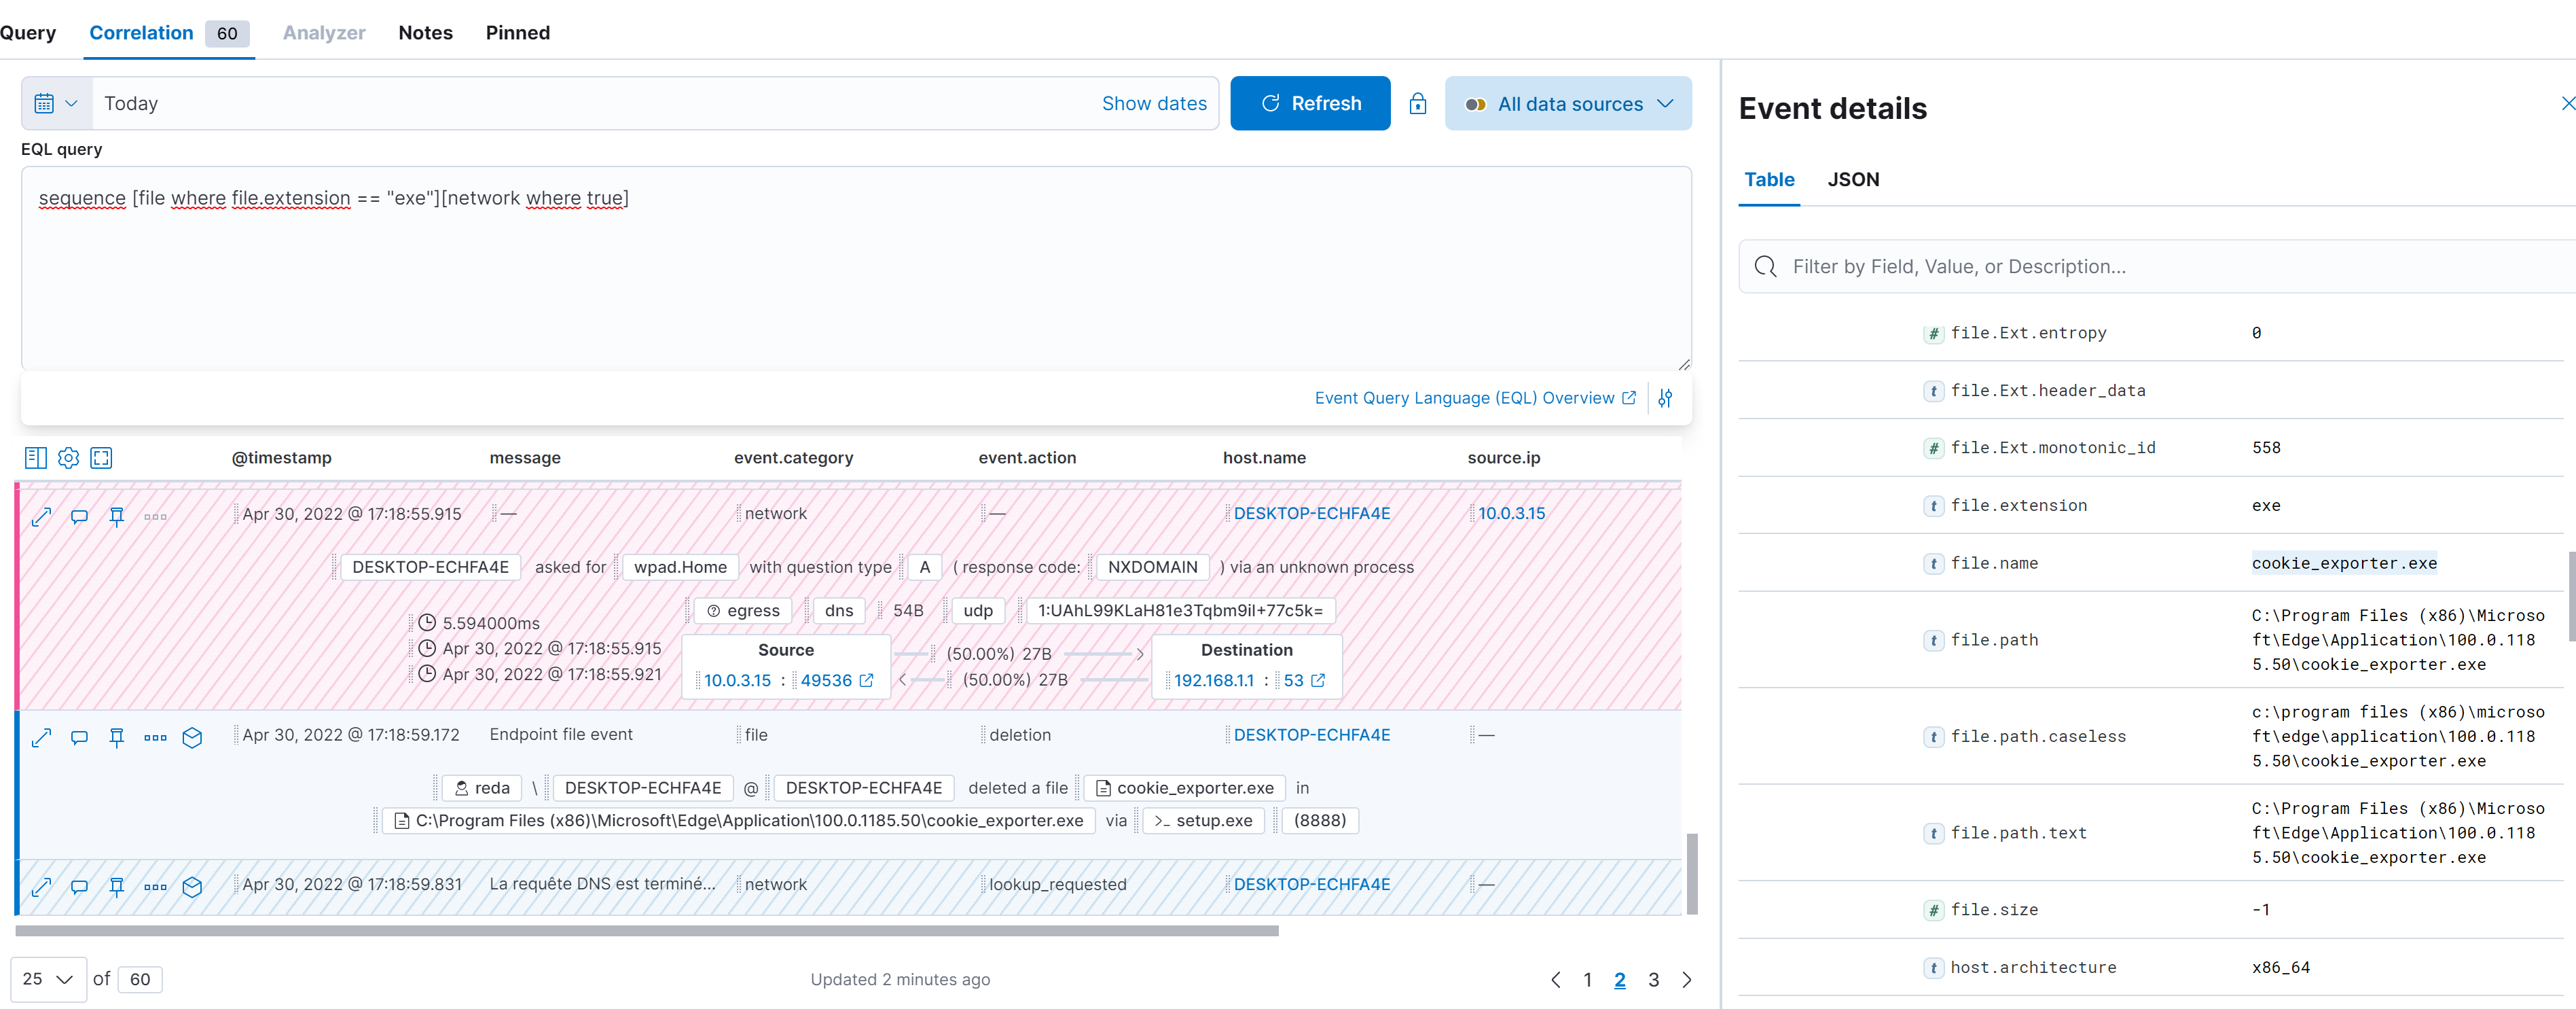
Example : Events Display with EQL
Event Query Language (EQL) is a query language for event-based time series data, such as logs, metrics, and traces.
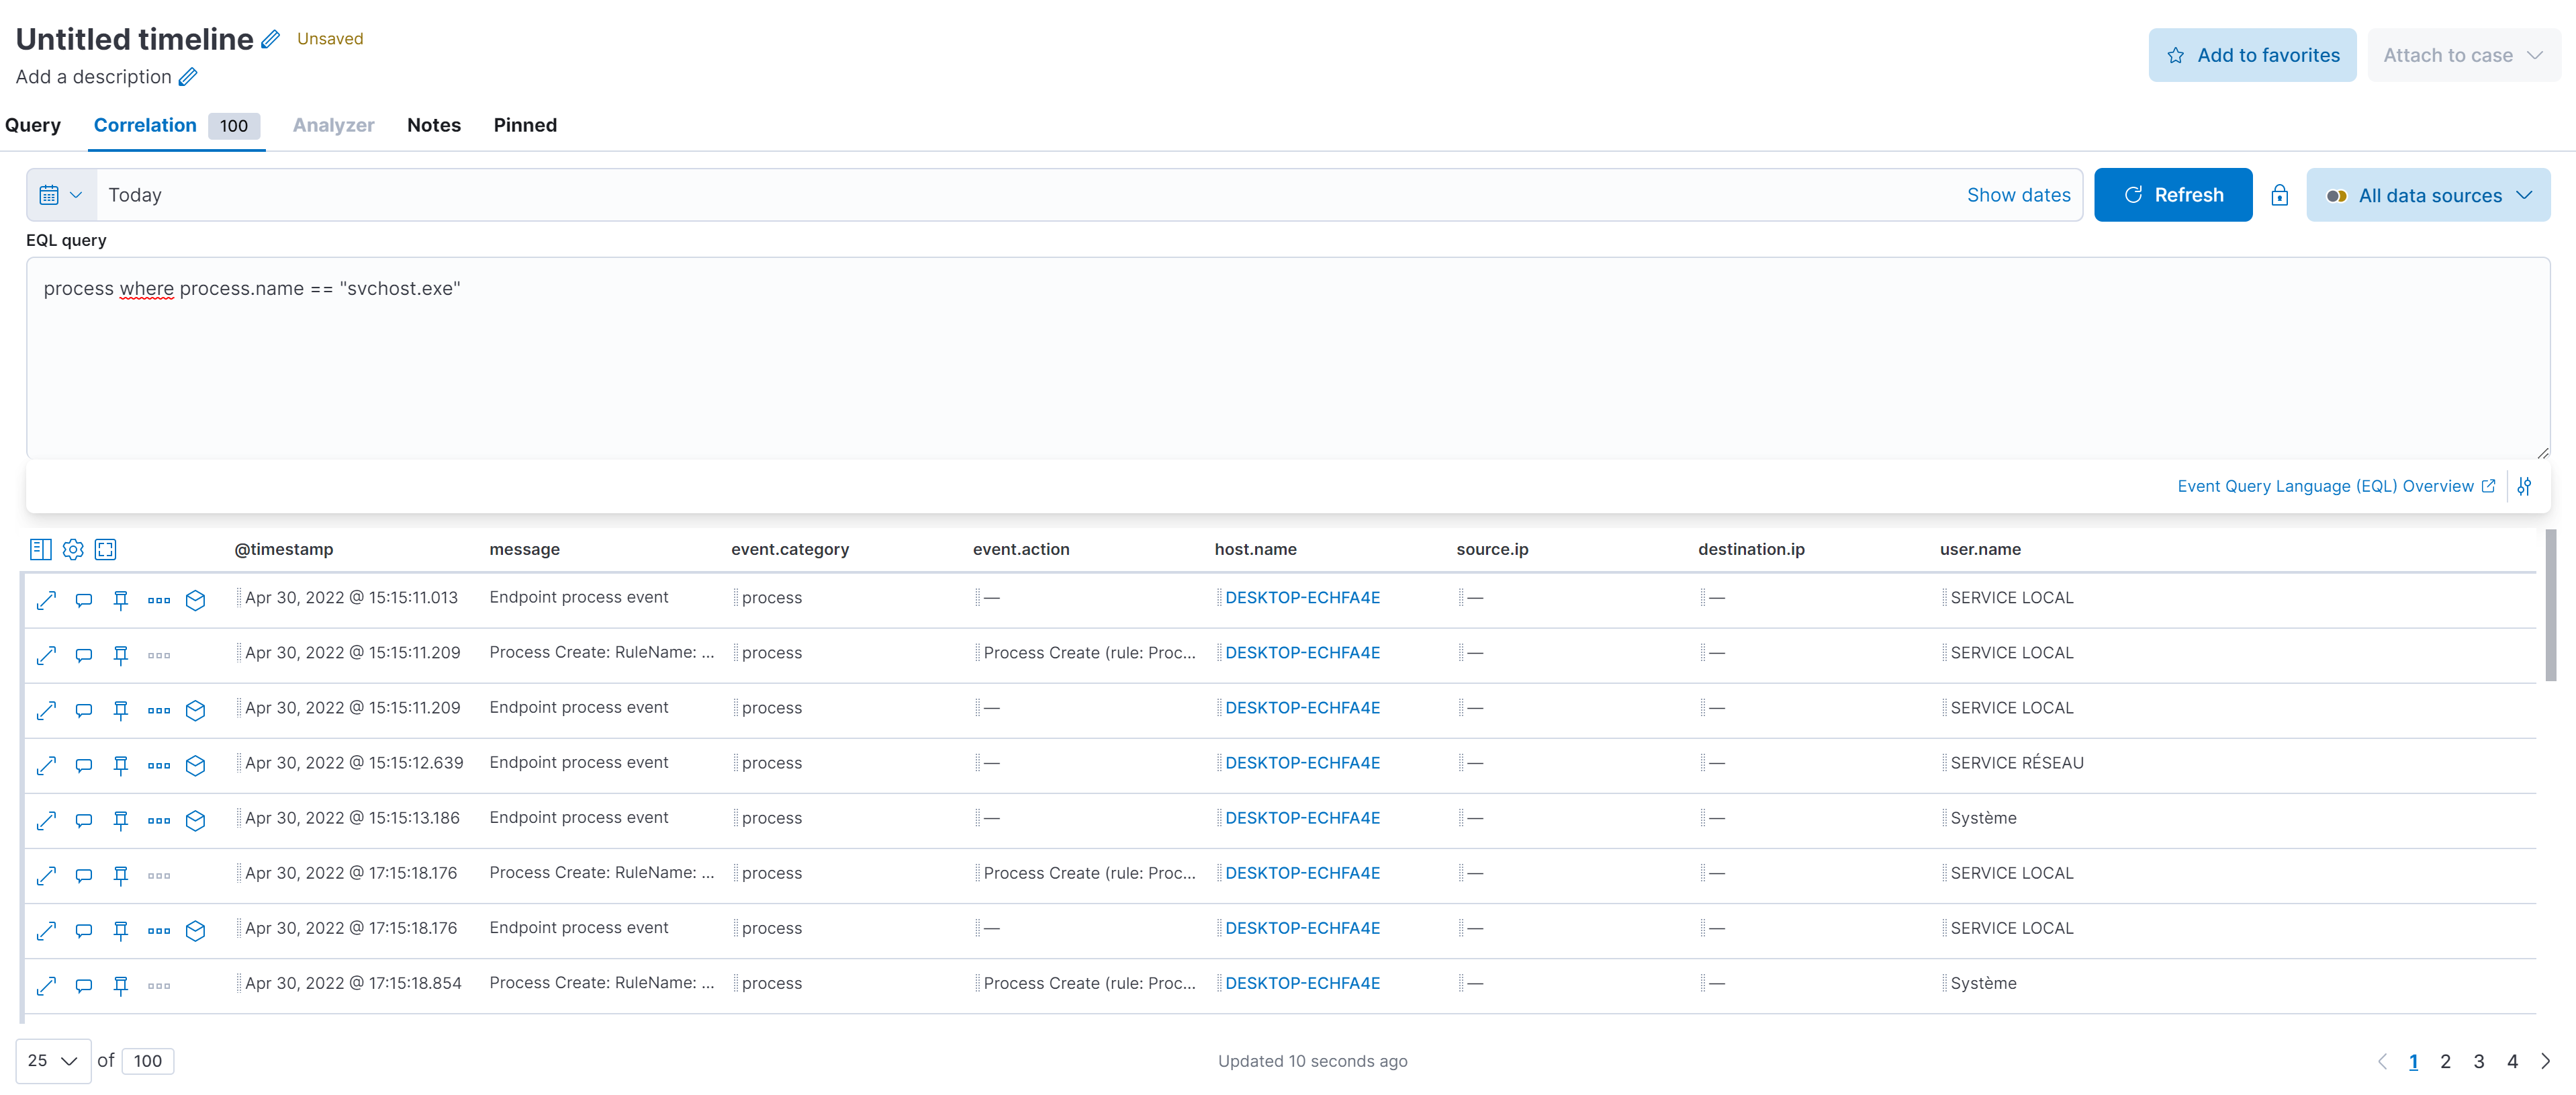
We are going to security timelines and create a new timeline and perform some queries:
process where process.name == "svchost.exe"The query show us every event in which the process.name is "svchost.exe"
sequence [file where file.extension == "exe"][network where true]The query perform an EQL search and returns back all the exe files that are making network connections like cookie_exporter.exe
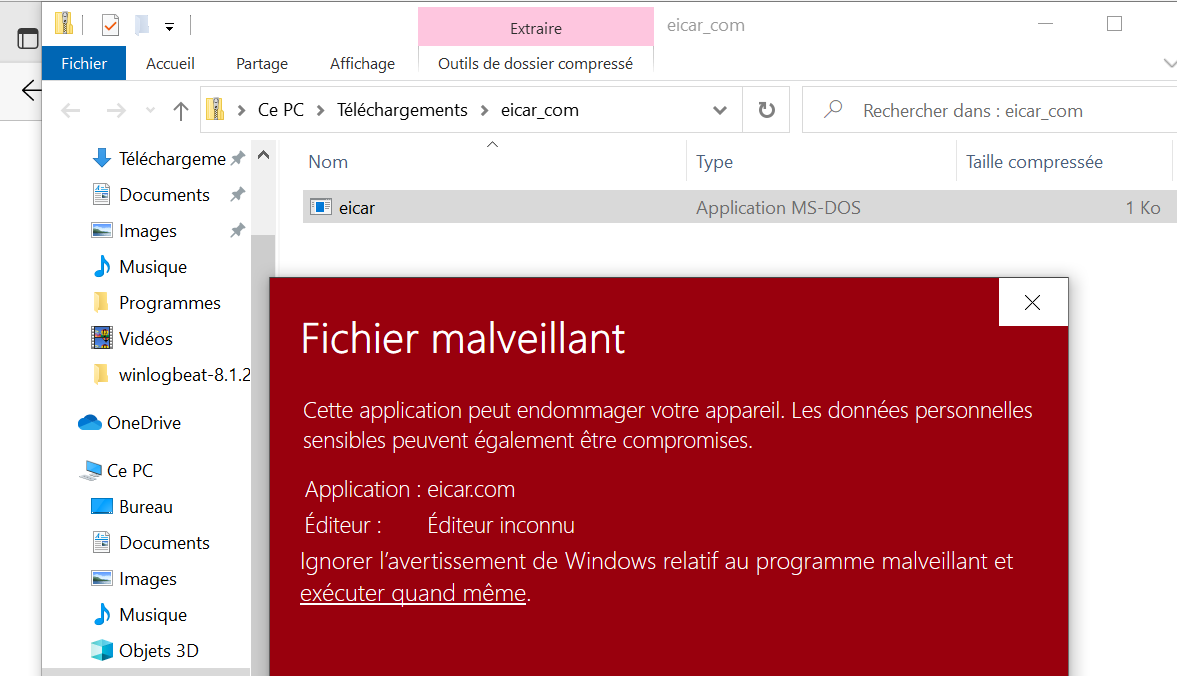
Third Scenario : EICAR Malware Test
We tested EICAR in our Windows victim:
- Link to download the test file : Download Anti Malware Testfile – Eicar
This test file has been provided to EICAR for distribution as the “EICAR Standard Anti-Virus Test File”, and it satisfies all the criteria listed above. It is safe to pass around, because it is not a virus, and does not include any fragments of viral code. Most products react to it as if it were a virus (though they typically report it with an obvious name, such as “EICAR-AV-Test“).
The file is a legitimate DOS program, and produces sensible results when run (it prints the message “EICAR-STANDARD-ANTIVIRUS-TEST-FILE!“).
After Downloading the test file we can run it in our VM:
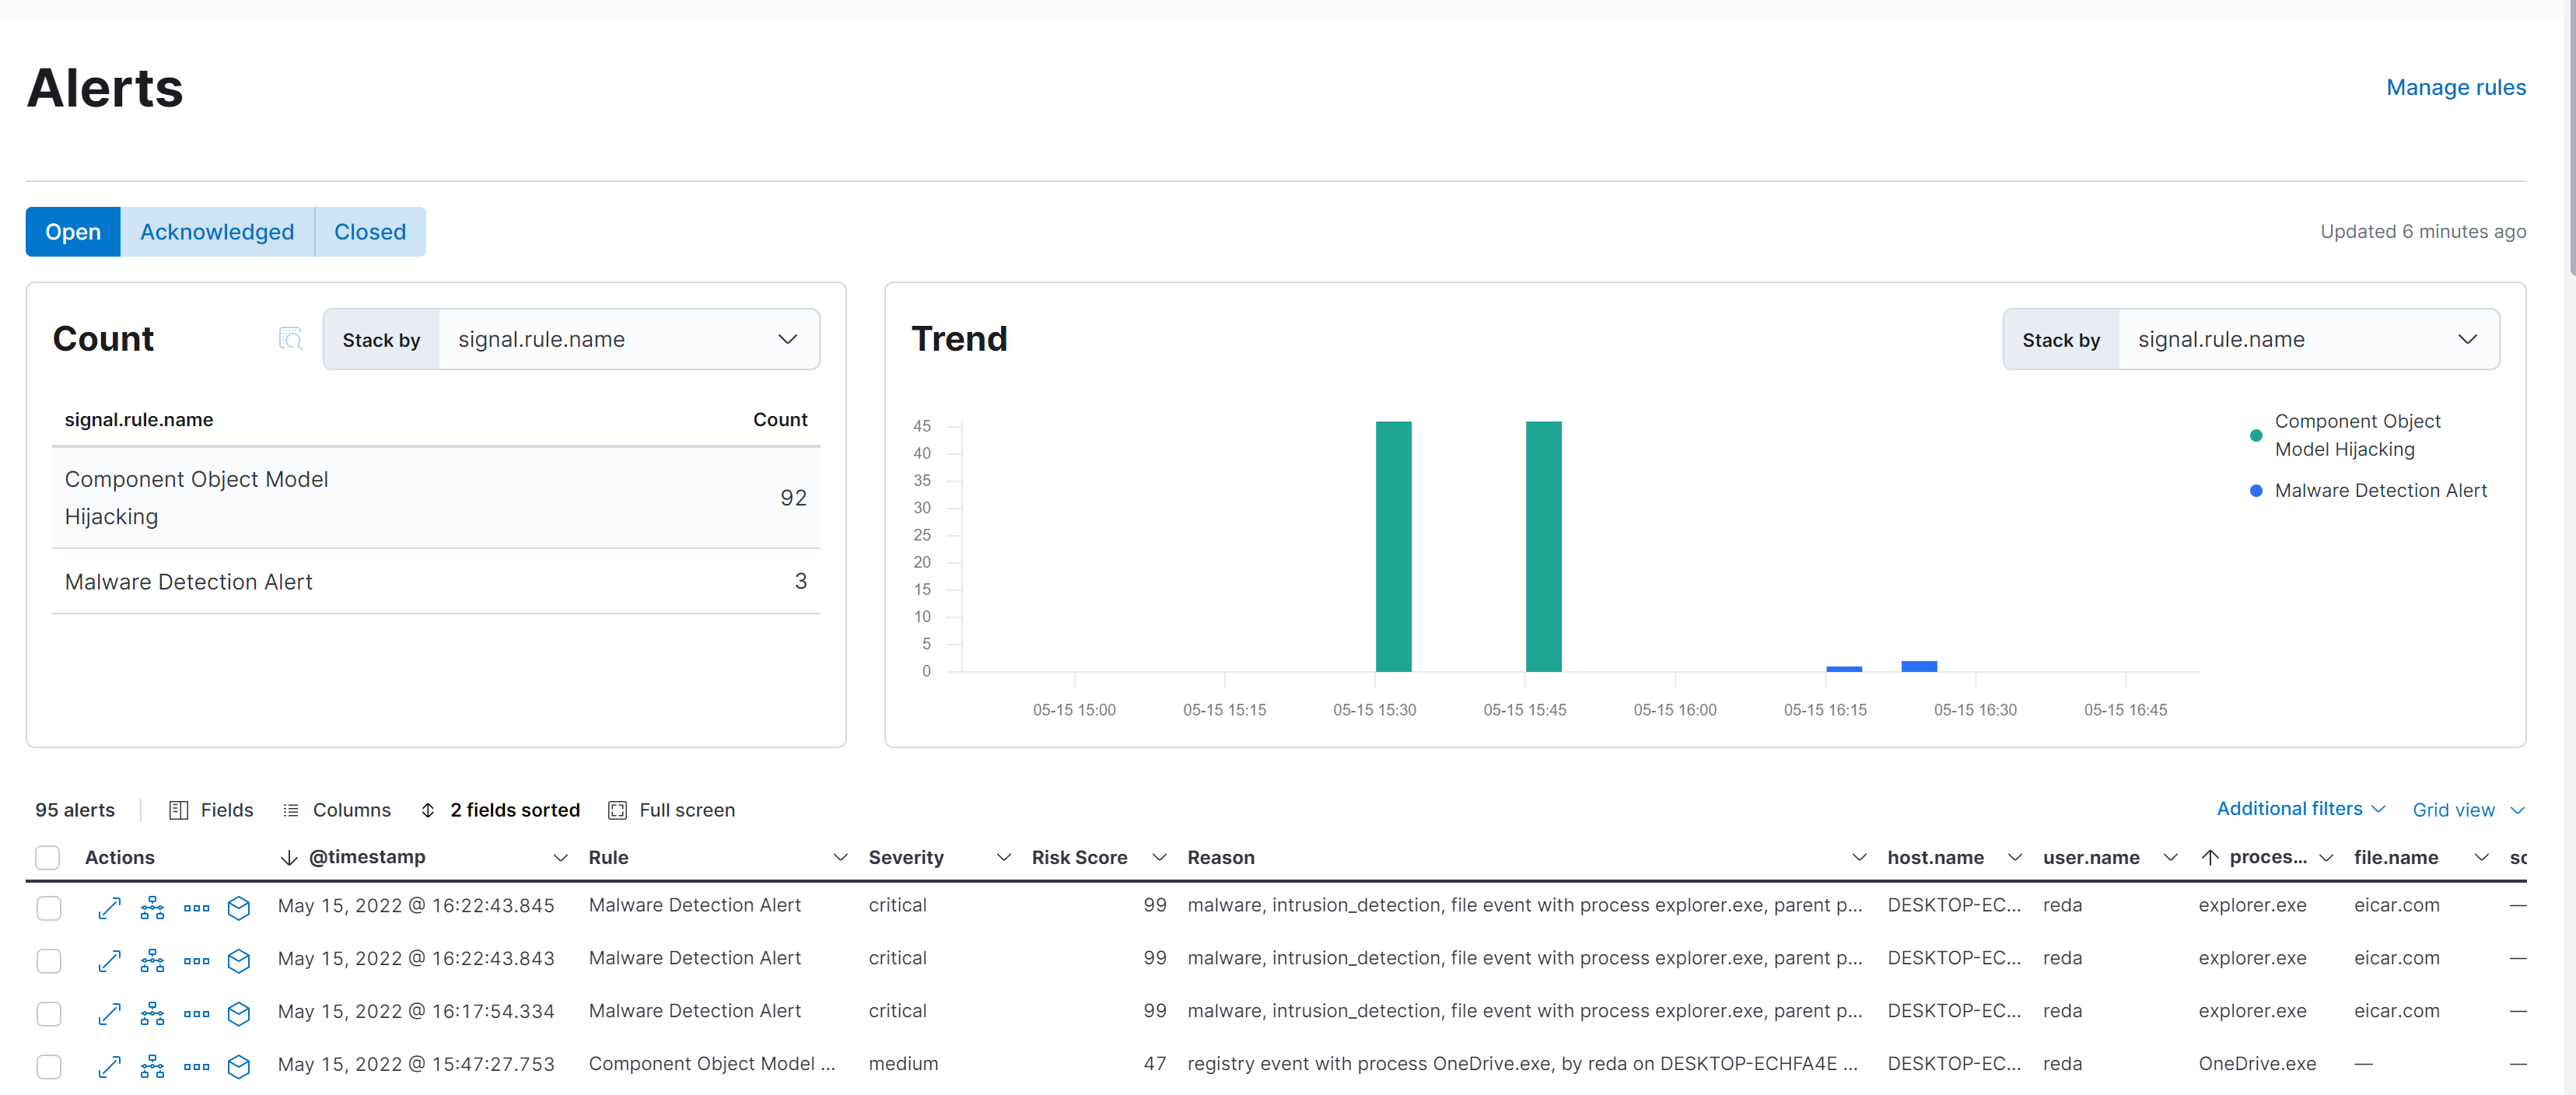
And we can see in our Kibana Security Alerts Dashboard that the action is detected as a Malware and with a severity of 99.
The green bar is just a false positive from OneDrive.exe
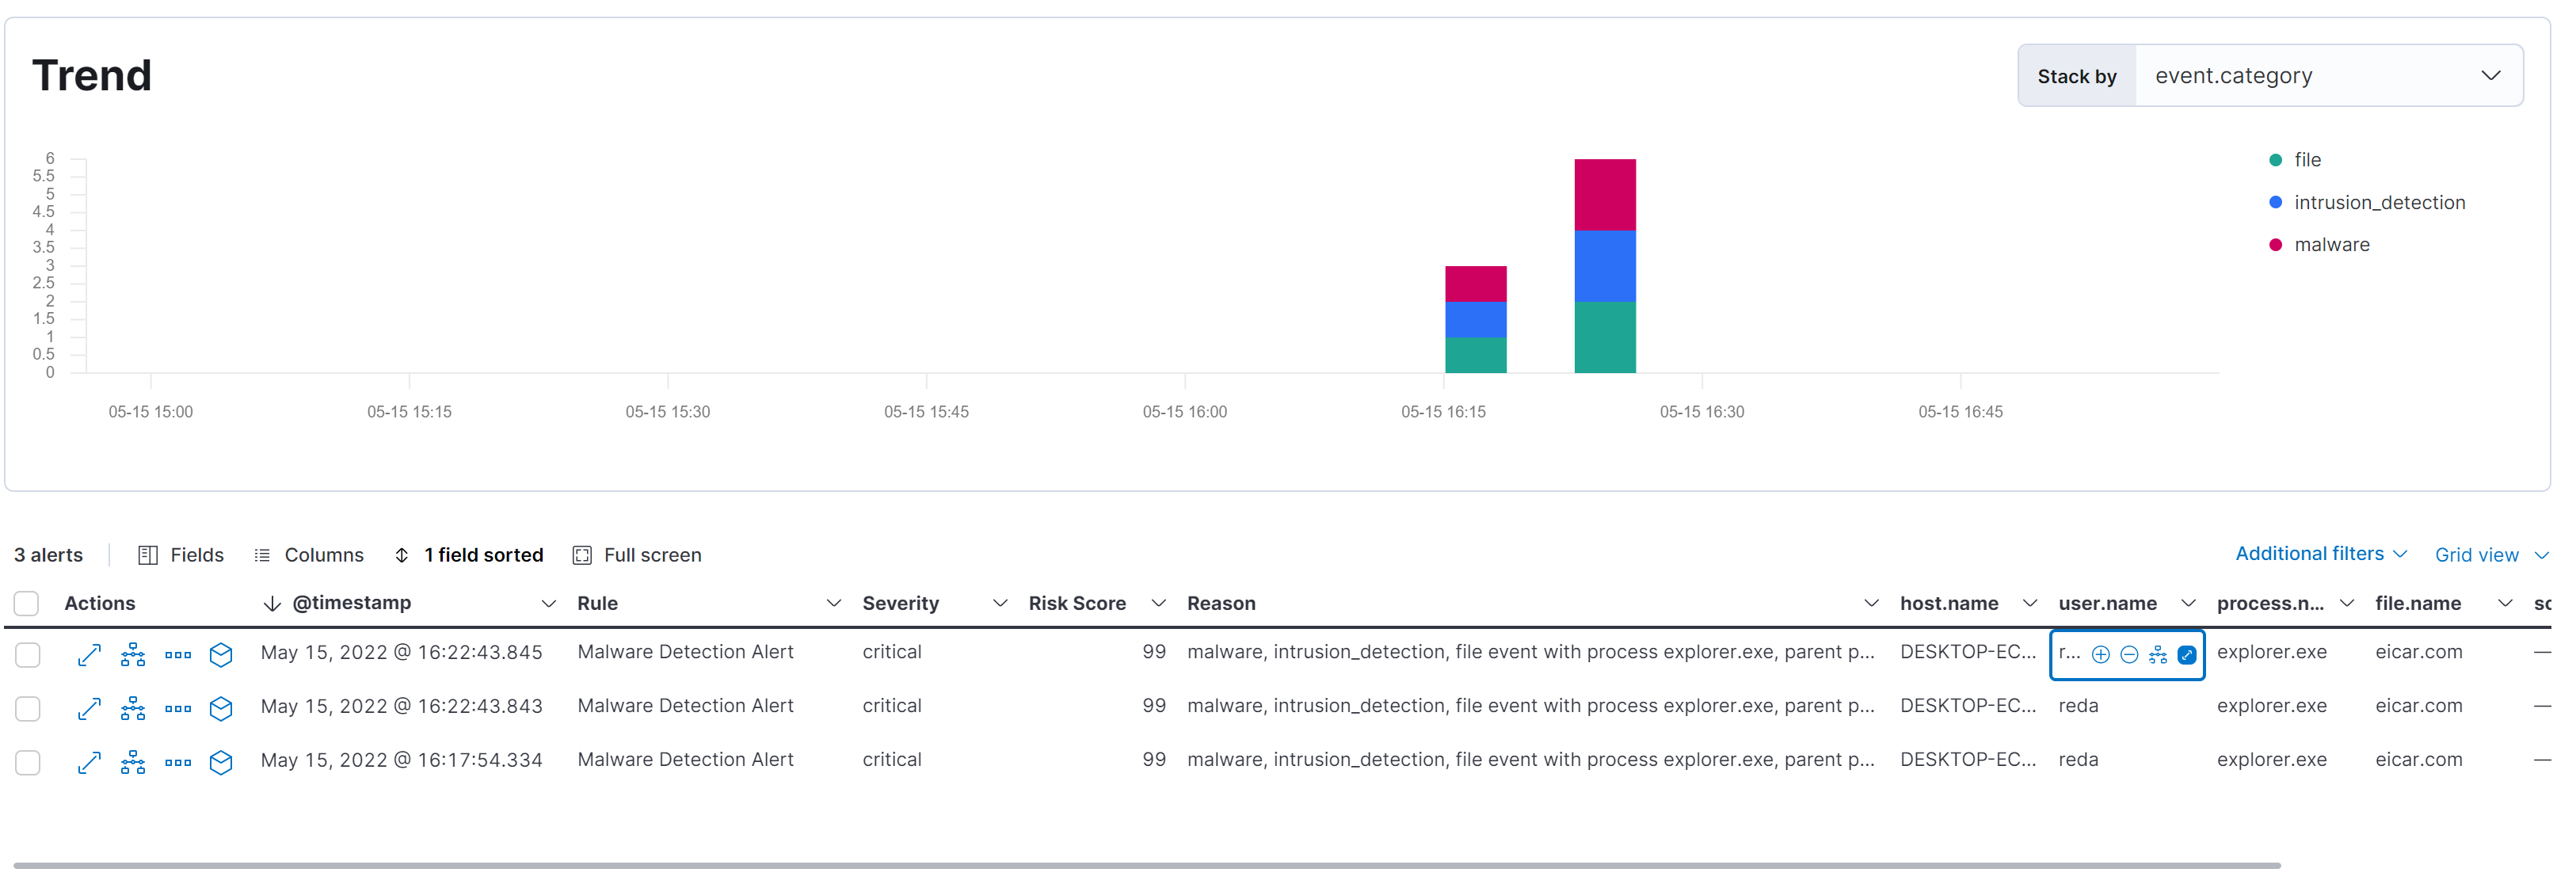
And also we can see the event category that display the type of event we detect:
Fourth Scenario : MITRE ATT&CK
MITRE ATT&CK® stands for MITRE Adversarial Tactics, Techniques, and Common Knowledge (ATT&CK). The MITRE ATT&CK framework is a curated knowledge base and model for cyber adversary behavior, reflecting the various phases of an adversary's attack lifecycle and the platforms they are known to target
First we need to install python 2
Also we will download the following project from Github that will let us test some MITTRE ATT&CK.
And after downloding and installing the requirements we need to run the program with full permission:
python.exe C:\\Users\reda\Downloads\RTA-master\RTA-master\run_all.py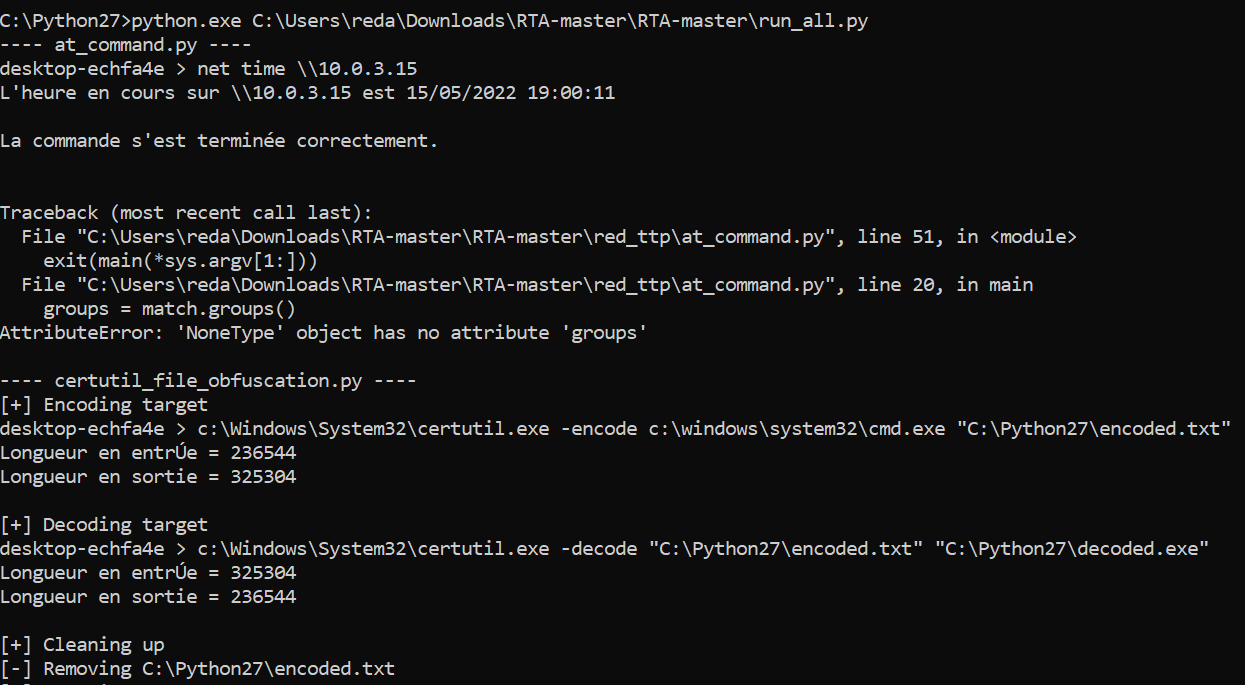
Within five minutes you should see a number of signals appear in the Detections page.
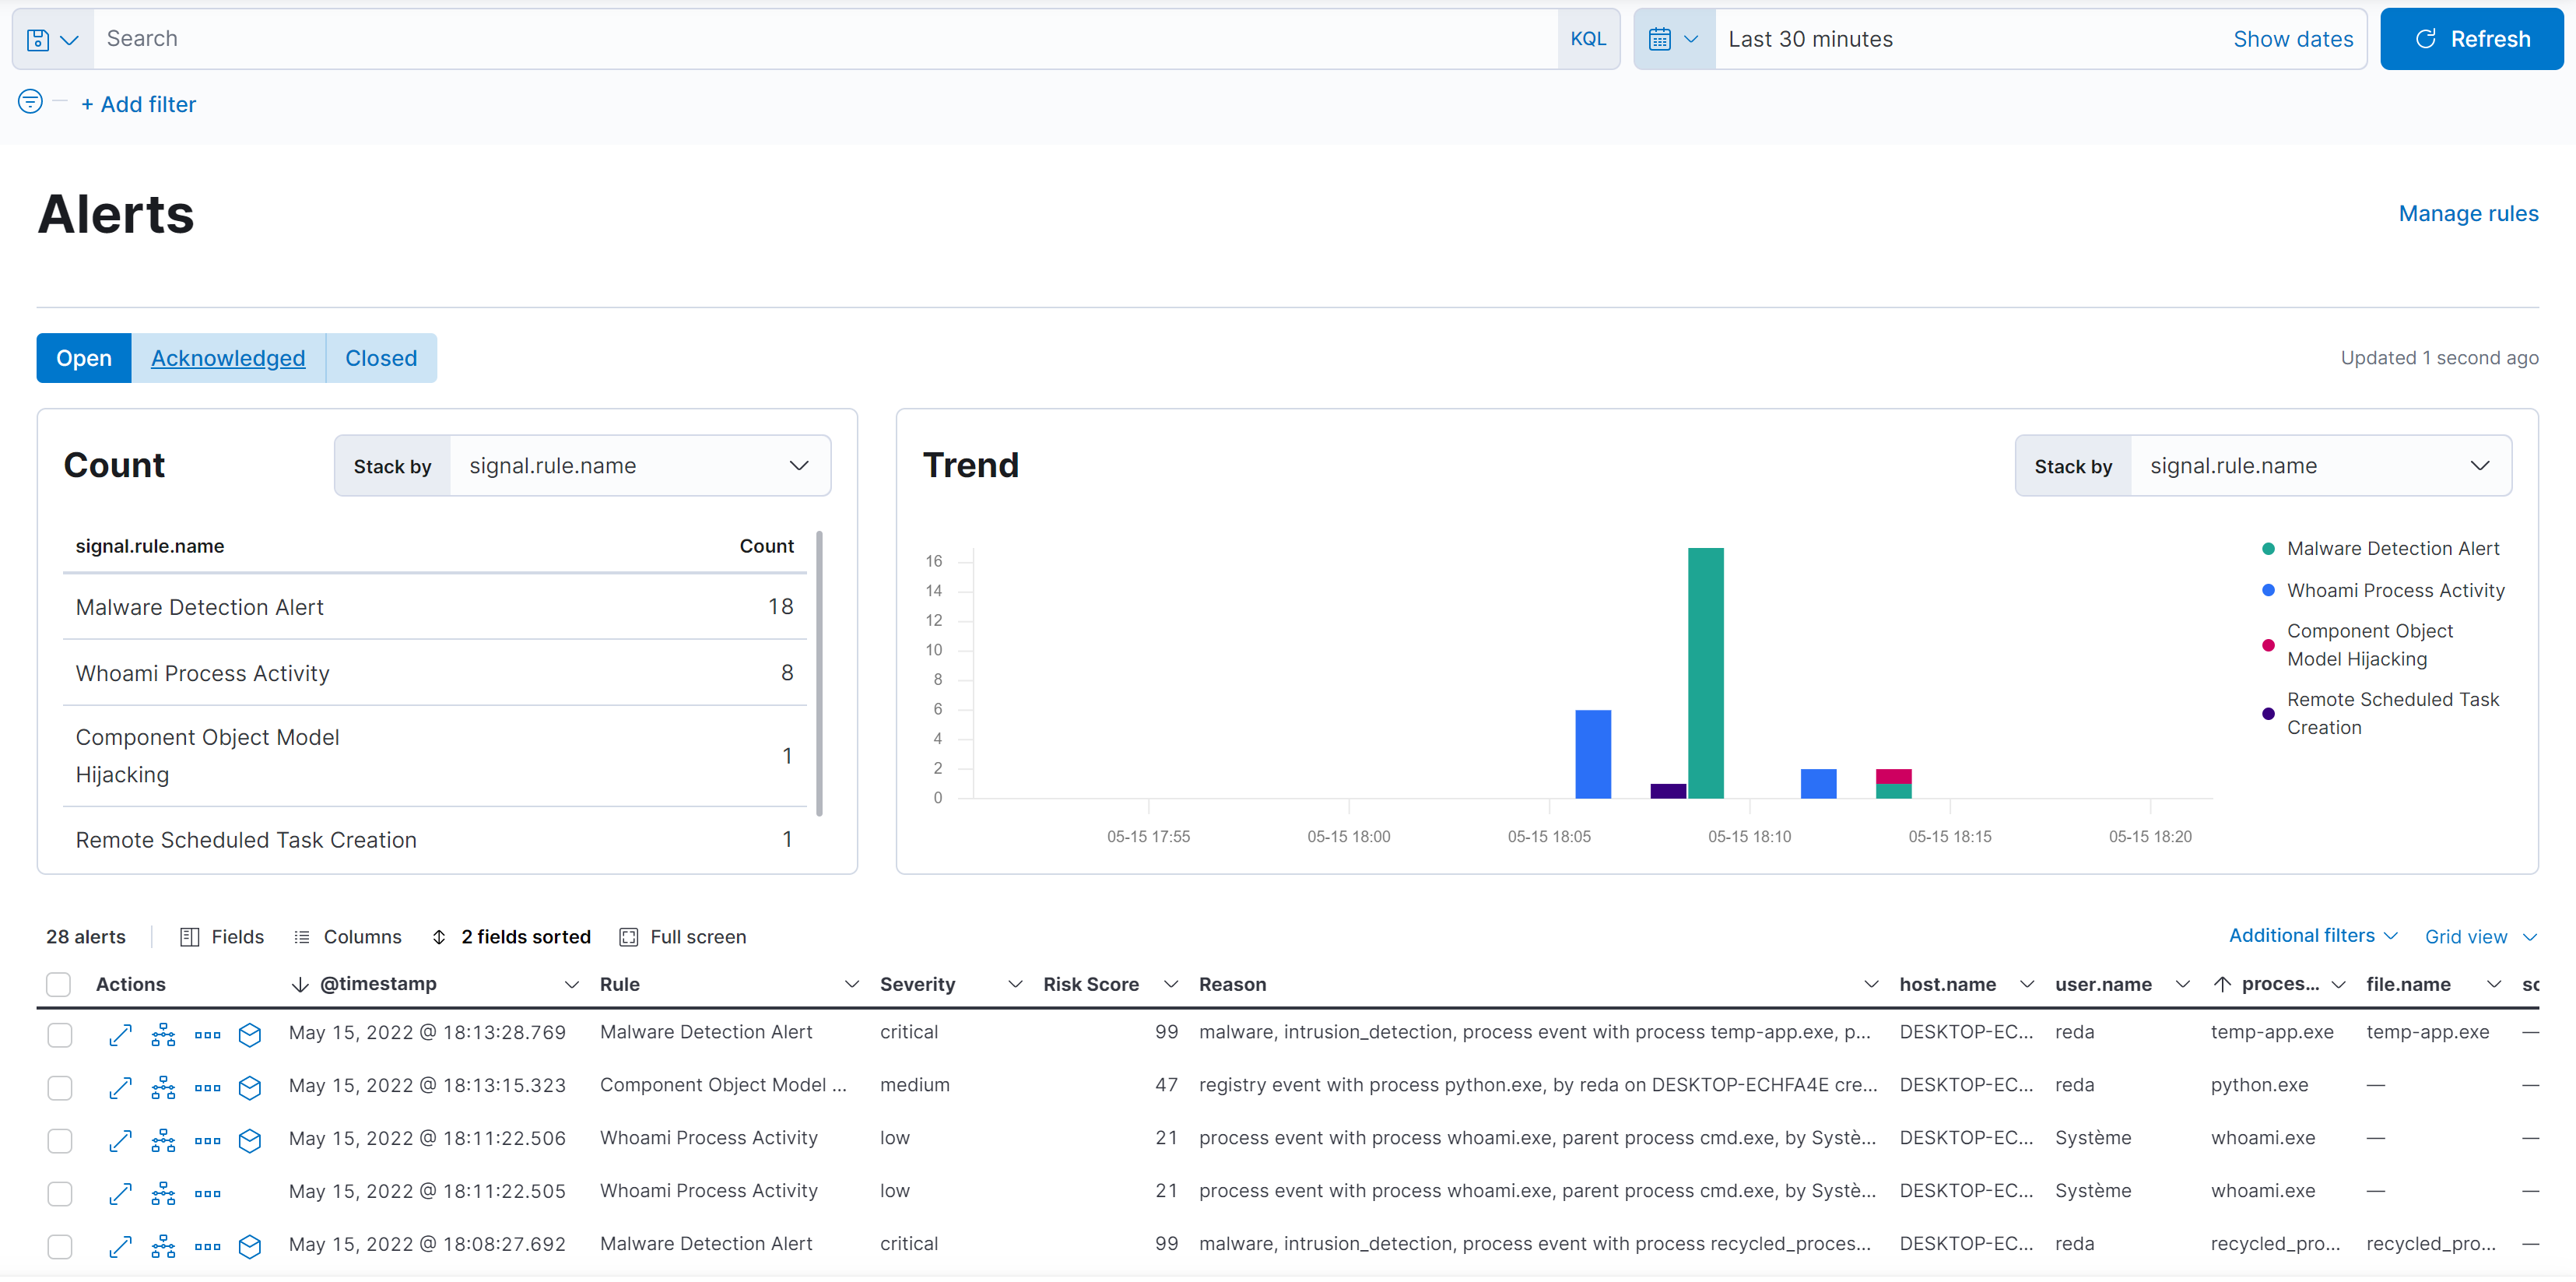
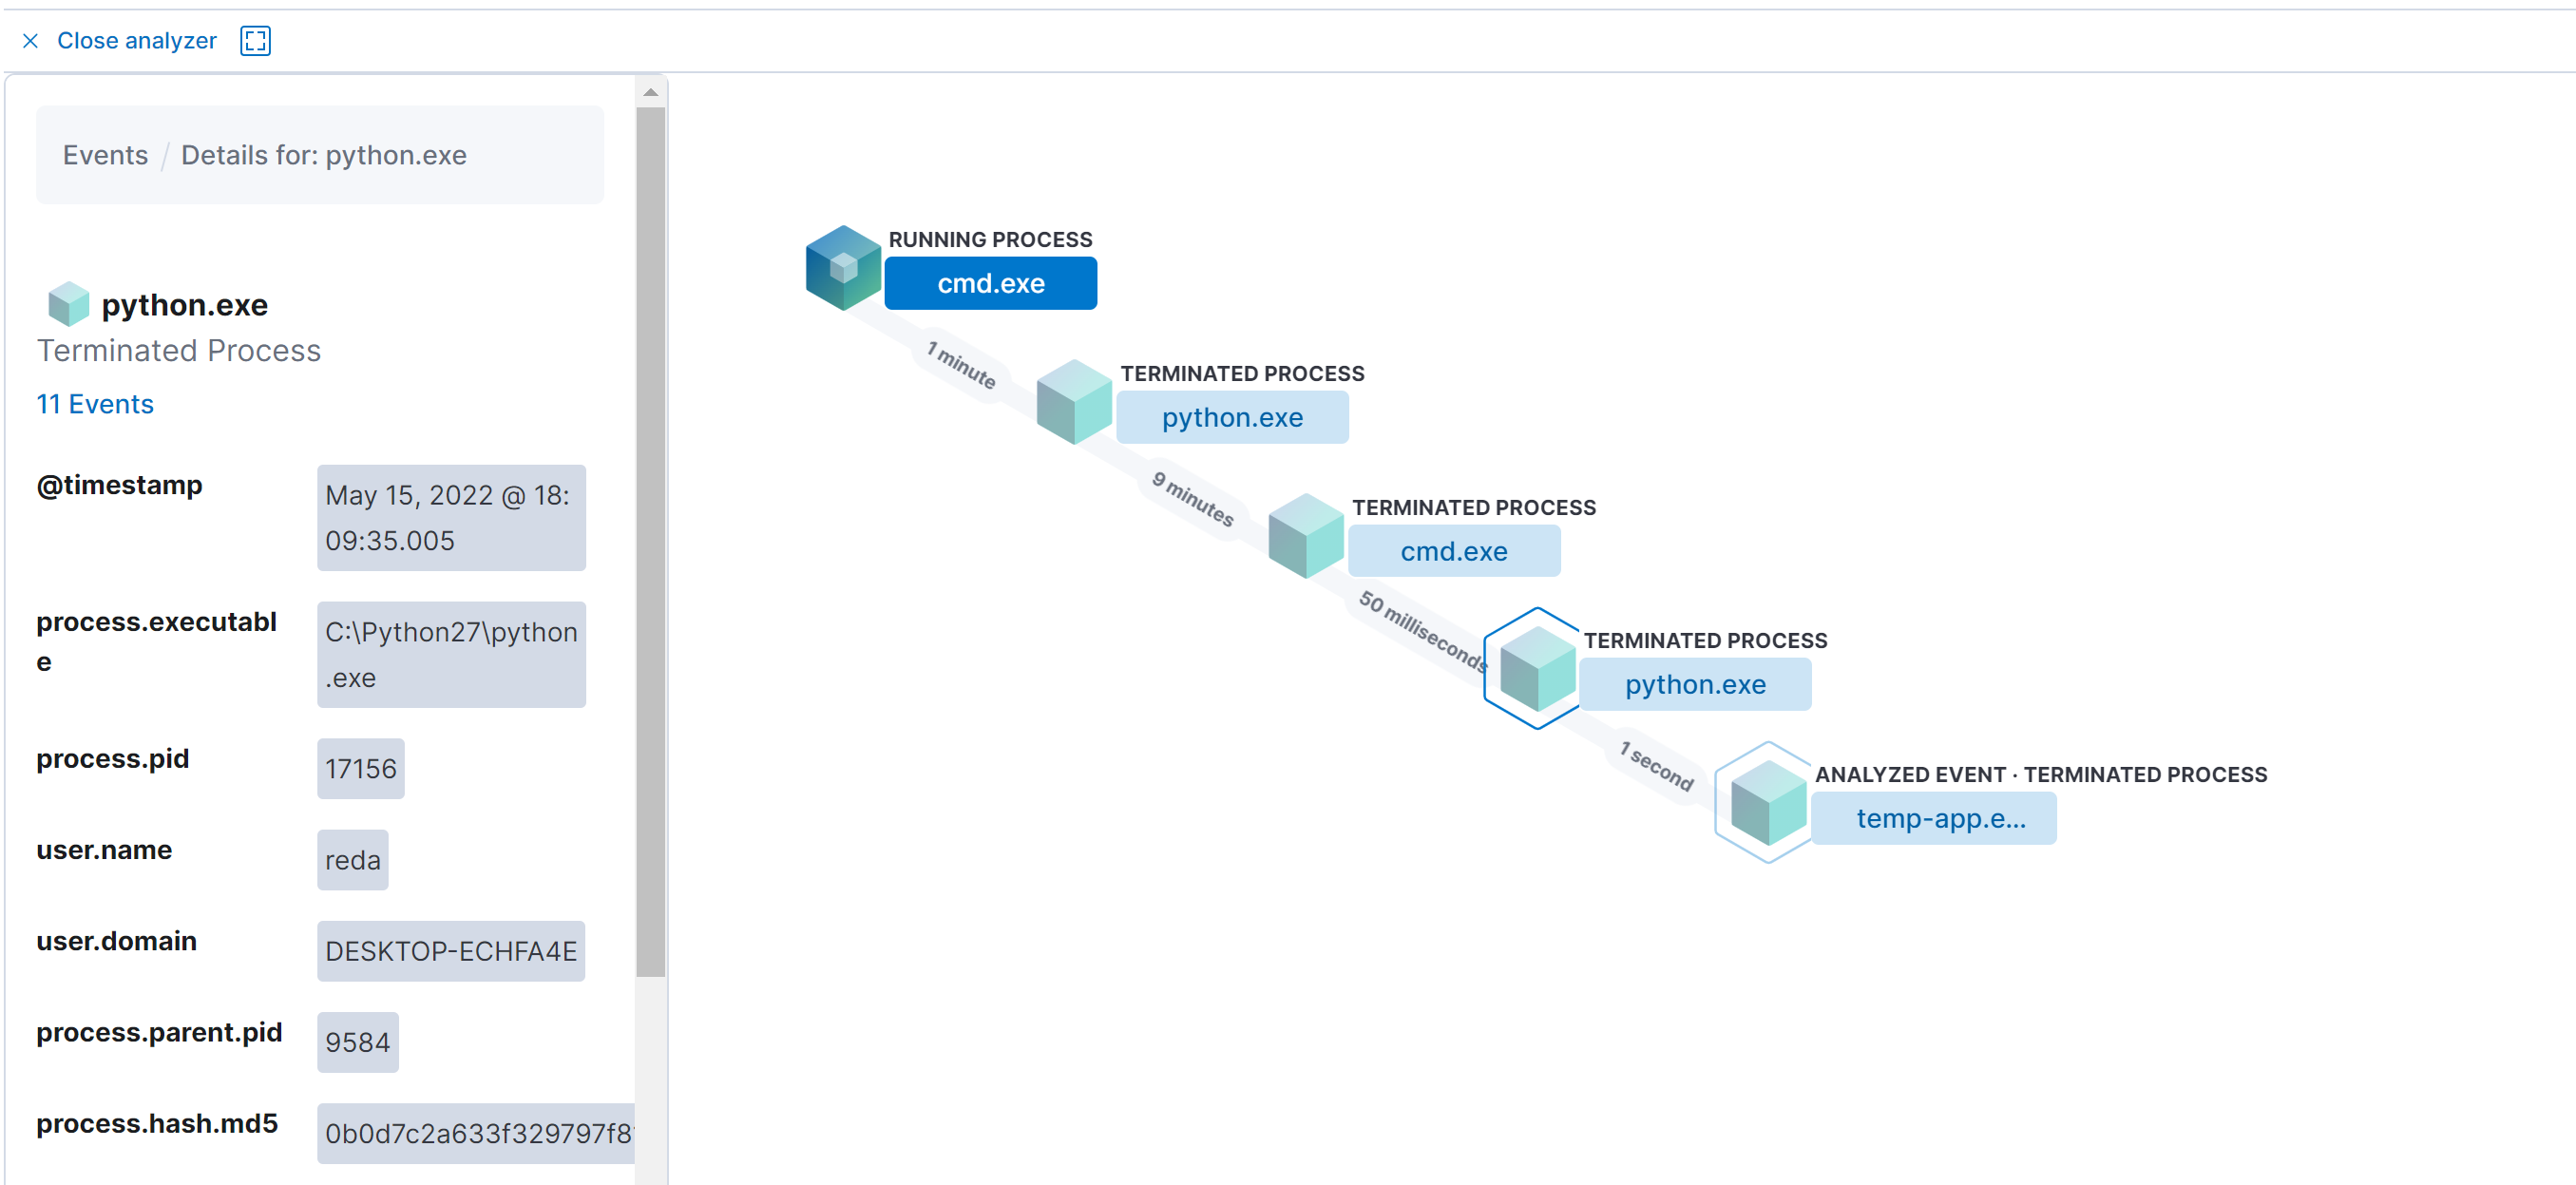
Analyze Example:
For example we can analyze this malware and we can see:
- Process parent: cmd.exe
- Each process and child process of the action.
- The timestamp of the action
- The Username that perform the action or has been victim to the action
Thanks for reading!!!
Reda BELHAJ
––– views